TR and TE in MRI
Repetition Time (TR)
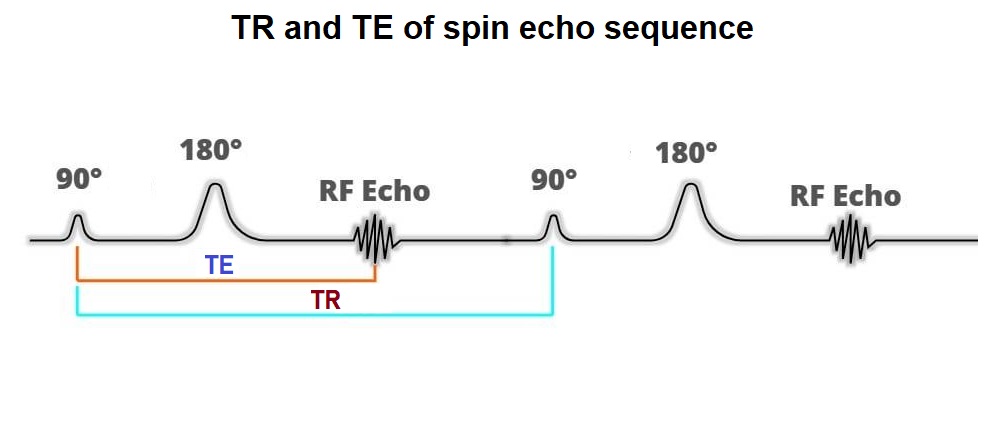
TR (Repetition Time) in Magnetic Resonance Imaging (MRI) is the time interval between successive pulse sequences applied to the same slice. Specifically, TR is the duration between the application of one RF (radiofrequency) pulse and the next. Measured in milliseconds (ms), TR primarily governs the extent of longitudinal relaxation (T1 relaxation) before the subsequent pulse, making it a vital parameter that significantly influences image contrast and signal characteristics in MRI.
Echo Time (TE)
Echo Time (TE) in MRI is the time between the delivery of the RF pulse and the peak of the signal (echo) received. TE is also measured in milliseconds (ms). It primarily affects the amount of transverse relaxation (T2 relaxation) that has occurred by the time the echo is measured. TE plays a significant role in differentiating various tissue types based on their relaxation properties.


Physics behind TR and TE
The physics underlying TR and TE in MRI involves the interaction between the magnetic field, the RF pulses, and the hydrogen nuclei (protons) in the body. Here’s a detailed breakdown:
Magnetic Field and Proton Alignment
- Main Magnetic Field (B0): When a patient is placed in the MRI scanner, they are exposed to a strong static magnetic field (B0). This field causes the magnetic moments of hydrogen nuclei (protons) in the body to align either parallel or antiparallel to the field. The majority of these protons align parallel, resulting in a net magnetization vector (M0) in the direction of the magnetic field.
RF Pulse and Excitation
- RF Pulse: A radiofrequency pulse at the Larmor frequency (specific to the magnetic field strength and the type of nuclei) is applied perpendicular to the main magnetic field. This RF pulse tips the net magnetization vector away from the longitudinal direction (along B0) into the transverse plane.
- Flip Angle: The angle by which the magnetization vector is tipped is known as the flip angle (e.g., 90 degrees for a full flip into the transverse plane).
Relaxation Processes
- T1 Relaxation (Longitudinal Relaxation): After the RF pulse is turned off, the magnetization vector starts to relax back to its equilibrium position along the B0 field. This recovery is characterized by the T1 relaxation time, which is the time constant for 63% recovery of longitudinal magnetization.
- T2 Relaxation (Transverse Relaxation): Simultaneously, the transverse component of the magnetization vector dephases due to interactions between nearby spins, characterized by the T2 relaxation time, which is the time constant for 63% decay of transverse magnetization.
Repetition Time (TR)
- Definition of TR: TR is the time between the application of one RF pulse and the next. It influences how much longitudinal magnetization has recovered before the next RF pulse is applied.
- Short TR: With a short TR, there is incomplete recovery of longitudinal magnetization, leading to saturation and affecting image contrast, particularly enhancing T1 contrast.
- Long TR: With a long TR, there is nearly complete recovery of longitudinal magnetization, minimizing saturation effects and enhancing T2 contrast.
Echo Time (TE)
- Definition of TE: TE is the time between the application of the RF pulse and the peak of the signal (echo) detected in the receiver coil. It determines when the signal is measured during the relaxation process.
- Short TE: A short TE captures signals early when there is minimal dephasing, which is important for T1-weighted imaging.
- Long TE: A long TE captures signals later when more dephasing has occurred, which is important for T2-weighted imaging.
Influence of TR and TE on Image Contrast
T1-weighted Imaging
Short TR and short TE values enhance T1-weighted contrast, making tissues with short T1 relaxation times (e.g., fat) appear bright, while those with longer T1 times (e.g., fluids) appear dark.
T2-weighted Imaging
Long TR and long TE values produce T2-weighted images, where tissues with long T2 relaxation times (e.g., fluids) appear bright. The long TR ensures complete longitudinal relaxation, while the long TE allows sufficient transverse dephasing for T2 contrast.
Proton Density-weighted Imaging
Intermediate TR and short TE values are used to produce proton density-weighted images, emphasizing differences in proton density with minimal T1 and T2 contrast effects.
T1 MRI Image with 500ms TR and 17ms TE

T2 MRI Image with 2500ms TR and 20ms TE

T2 MRI Image with 3500ms TR and 110ms TE

Impact of repetition time (TR) in T2-weighted MRI images
Low TR (1000 ms):
- Results in relatively low SNR, leading to noisier images.
- T2 contrast is suboptimal because tissues don’t have sufficient time to relax between successive excitations, reducing the distinction between different tissue types.
Medium TR (2000 ms):
- Provides a moderate SNR, improving image quality compared to lower TR settings.
- Offers better T2 contrast than low TR but still might not be optimal for clearly differentiating all tissue types.
Best TR (3000-4000 ms):
- Optimal for maximizing T2 contrast, allowing different tissues to be distinguished more clearly.
- Higher SNR results in clearer and more detailed images, as tissues have ample time for relaxation and signal recovery between excitations.
High TR (10000 ms):
- Results in very high SNR, producing the clearest images with minimal noise.
- While excellent for SNR, extremely long TR can lead to prolonged scan times, which might not be practical or comfortable for all patients.
T2 MRI Image with 1000ms TR and 107ms TE

T2 MRI Image with 2000ms TR and 107ms TE

T2 MRI Image with 4000ms TR and 107ms TE

T2 MRI Image with 10000ms TR and 107ms TE

Impact of echo time (TE) on T2-weighted MRI images
Low TE (15-25 ms):
- Produces Proton Density (PD) contrast: At this short TE, the image has minimal T2 weighting, emphasizing proton density contrast where signal intensity is more related to the number of hydrogen protons in the tissue.
- Signal-to-Noise Ratio (SNR): High SNR due to minimal signal decay, capturing a strong signal from the tissues.
Medium TE (50-60 ms):
- Image Contrast: Begins to show increased T2 weighting, where tissues with longer T2 relaxation times (like fluid-filled structures) appear brighter.
- SNR Impact: Moderate SNR; some signal loss occurs due to T2 decay, which can reduce image clarity compared to low TE.
Best TE (100-110 ms):
- Image Contrast: Optimally enhances T2 contrast, making it ideal for detecting pathologies like edema and gliosis that have prolonged T2 relaxation times.
- SNR Impact: Good balance between sufficient T2 contrast and acceptable SNR, though some signal degradation is inevitable.
High TE (200-400 ms):
- Increased T2 weighting: Further emphasizes T2 contrast but at the expense of increased signal decay from faster relaxing tissues.
- SNR: Lower SNR due to significant signal decay, reducing overall image sharpness and detail.
- Reduces Tissue Contrast: High TE reduces the differentiation between tissues with slightly different T2 relaxation times, potentially obscuring fine details.
T2 MRI Image with 5000ms TR and 20ms TE

T2 MRI Image with 5000ms TR and 50ms TE

T2 MRI Image with 5000ms TR and 100ms TE

T2 MRI Image with 5000ms TR and 250ms TE

Impact of repetition time (TR) in T1-weighted MRI images
Low TR (150 ms):
- Utilizing a low TR in T1-weighted imaging leads to a reduction in SNR because the tissues do not have sufficient time to fully recover their longitudinal magnetization. This results in weaker overall signal intensity and less effective differentiation of T1 contrast between different tissues.
Medium TR (250 ms):
- At a medium TR setting, there is a slight improvement in SNR compared to very low TR. Tissues have more time for magnetization recovery, which enhances signal strength but still does not provide optimal contrast for T1-weighted images.
Best TR (300-500 ms):
- This TR range is considered ideal for T1-weighted imaging. It allows for a good balance between SNR and tissue contrast. Tissues recover enough longitudinal magnetization to produce a strong signal, facilitating better differentiation of T1 properties across different tissue types.
High TR (2000 ms):
- A high TR substantially increases SNR because tissues reach near-complete recovery of their longitudinal magnetization, maximizing signal intensity. However, at such high TR values, the image enhances not only T1 but also proton density (PD) contrast. This mixed contrast can be useful but might obscure pure T1 contrast effects.
T1 MRI Image with 150 ms TR and 20ms TE

T1 MRI Image with 250ms TR and 20ms TE

T1 MRI Image with 400ms TR and 20ms TE

T1 MRI Image with 2000ms TR and 20ms TE

Optimal TR (repetition time) and TE (echo time) parameters for various MRI sequences at 1.5 Tesla and 3 Tesla
T1-Weighted Imaging
1.5T:
- TR: 400-700 ms
- TE: 10-20 ms
3T:
- TR: 700-1000 ms
- TE: 10-20 ms
T2-Weighted Imaging
1.5T:
- TR: 3000-5000 ms
- TE: 80-110 ms
3T:
- TR: 5000-7000 ms
- TE: 100-120 ms
Proton Density (PD) Imaging
1.5T:
- TR: 2000-5000 ms
- TE: 10-30 ms
3T:
- TR: 3000-6000 ms
- TE: 10-30 ms
Short Tau Inversion Recovery (STIR)
1.5T:
- TR: 4000-6000 ms
- TE: 50-100 ms
- TI: 130-180 ms
3T:
- TR: 5000-8000 ms
- TE: 50-100 ms
- TI: 180-220 ms
Fluid Attenuated Inversion Recovery (FLAIR)
1.5T:
- TR: 6000-8000 ms
- TE: 100-120 ms
- TI: 2000-2500 ms
3T:
- TR: 9000-12000 ms
- TE: 100-140 ms
- TI: 2200-2600 ms
Gradient Echo (GRE) T2*
1.5T:
- TR: 5-10 ms
- TE: 2-5 ms
3T:
- TR: 6-15 ms
- TE: 2-6 ms
Gradient Echo (GRE) T1
1.5T:
- TR: 10-30 ms
- TE: 2-5 ms
- Flip Angle: 20-30°
3T:
- TR: 10-50 ms
- TE: 2-5 ms
- Flip Angle: 20-30°
References
- Pai, A., Shetty, R., Hodis, B. and Chowdhury, Y.S. (2023) ‘Magnetic Resonance Imaging Physics’, StatPearls [Internet]. Available at: https://www.ncbi.nlm.nih.gov/books/NBK572133/
- Alzola-Aldamizetxebarria, S., Fernández-Méndez, L., Padro, D., Ruíz-Cabello, J. and Ramos-Cabrer, P., 2022. A Comprehensive Introduction to Magnetic Resonance Imaging Relaxometry and Contrast Agents. ACS Omega, [online] 7(42), pp.36905-36917. Available at: https://www.ncbi.nlm.nih.gov/pmc/articles/PMC9609087/
- Musculoskeletal MRI at 3.0 T: Relaxation Times and Image Contrast. (n.d.). American Journal of Roentgenology. Available at: https://www.ajronline.org/doi/full/10.2214/AJR.04.343
- Shin, S., Yun, S. D., & Shah, N. J., 2023. T2* quantification using multi-echo gradient echo sequences: a comparative study of different readout gradients. Scientific Reports, 13, Article 1138.