MRI Echo Train Length (ETL)
Echo train length
Echo train length (ETL) is a crucial parameter in magnetic resonance imaging (MRI) that significantly impacts image acquisition time and image quality. ETL refers to the number of echoes acquired during an MRI sequence after a single excitation pulse. By increasing the ETL, multiple echoes are gathered during one repetition time (TR), significantly reducing scan time while maintaining image quality.

In general, the acquisition time for an MRI sequence is inversely proportional to the ETL. This means that as the ETL increases, the image acquisition time decreases. For example, if a conventional spin-echo (SE) sequence with a specific repetition time (TR), echo time (TE), and spatial resolution takes 8 minutes to perform, a fast spin-echo (FSE) sequence with an ETL of 8 would only require 1 minute to acquire a similar image.
ETL also plays a crucial role in determining image contrast and quality. Longer ETLs contribute to greater T2-weighting in the image because more late echoes with longer TE values are included. This enhances the visibility of tissues with longer T2 relaxation times, such as fluid-filled structures or pathology that exhibits prolonged T2 relaxation.
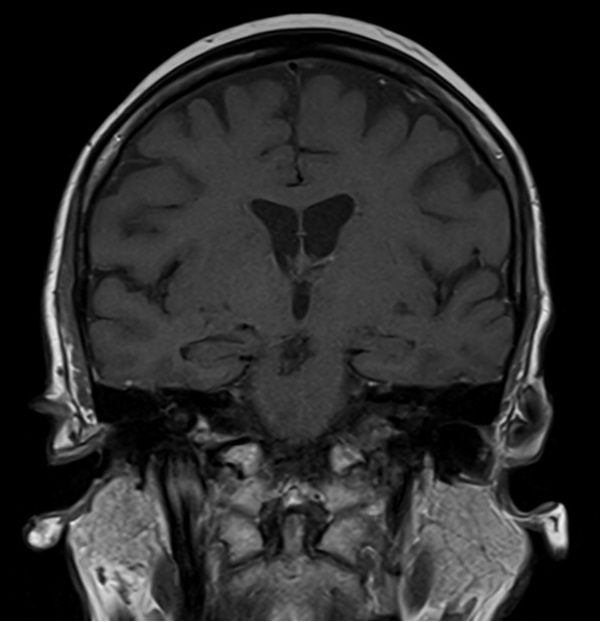
T1 SE image of brain

Scan time : 2.50minutes
T1 TSE image of brain

Scan time : 1.20minutes
Echo Train Length (ETL) and SNR
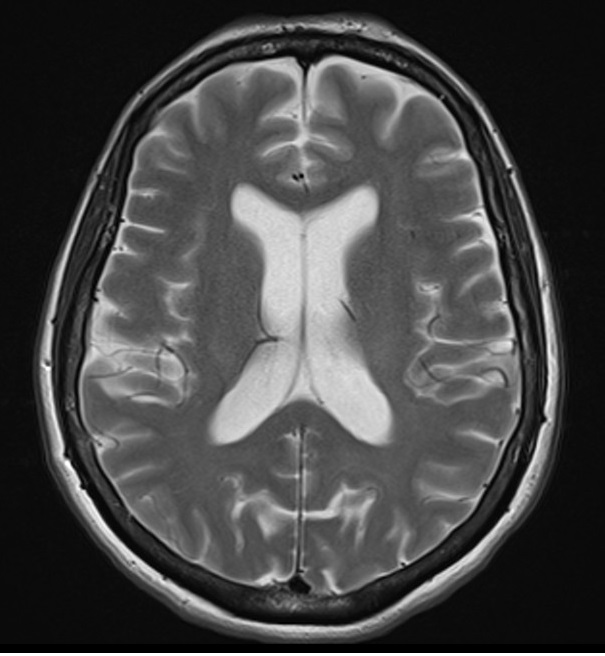
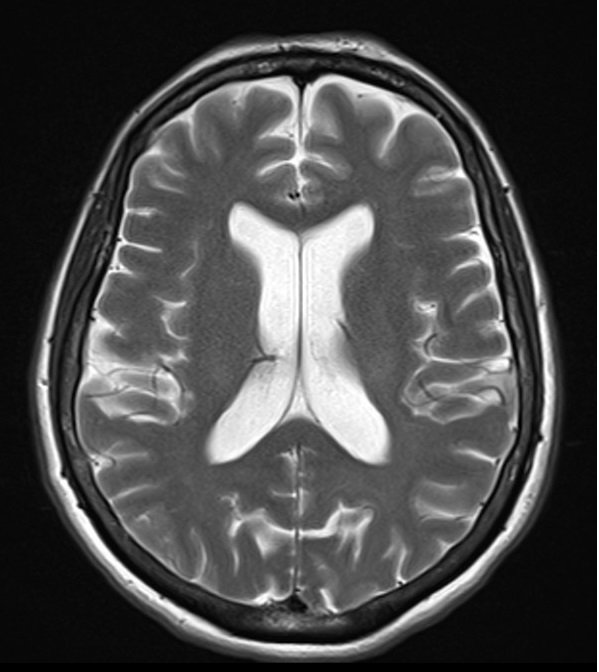
longer echo train lengths (ETLs) in MRI can lead to a decrease in overall signal-to-noise ratio (SNR) and contrast-to-noise ratio (CNR). The SNR is determined by the magnitude of the received signal, and as the ETL increases, the later echoes in the train tend to have lower signal amplitudes compared to the initial echoes. This can be attributed to factors such as T2* decay, relaxation effects, and other sources of signal loss.
Since the later echoes in a longer ETL are weaker, they contribute less to the overall signal, resulting in a decrease in SNR. As a consequence, the ability to discern subtle differences in tissue contrast and detect small variations in signal intensity, reflected by the CNR, may also be reduced.
ETL 5

ETL 10

ETL 25

Echo Train length (ETL) and specific absorption rate(SAR)
longer ETLs in MRI sequences can lead to higher SAR values. This is because a longer ETL requires a longer train of RF pulses to generate multiple echoes. Each RF pulse contributes to the overall SAR. Therefore, as the number of RF pulses increases with a longer ETL, the cumulative SAR also increases.
References
- Weigel, M. (2015). Extended phase graphs: Dephasing, RF pulses, and echoes – pure and simple. Journal of Magnetic Resonance Imaging, 41(2), 266-295.
- Haase, A., Frahm, J., Matthaei, D., Hänicke, W., Merboldt, K. D., & Hänicke, W. (1986). FLASH imaging. Rapid NMR imaging using low flip-angle pulses. Journal of Magnetic Resonance, 67(2), 258-266.
- Bernstein, M. A., King, K. F., & Zhou, X. J. (Eds.). (2018). Handbook of MRI Pulse Sequences. Elsevier.
- Smith, M. R., & Bernstein, M. A. (1997). Surface coil magnetic resonance imaging of the distal radius: imaging at a high spatial resolution. Journal of Magnetic Resonance Imaging, 7(6), 1040-1044.
- Hardy, C. J., & Cline, H. E. (1990). Mapping T2 and proton density at 3T: an evaluation of sequence performance. Journal of Computer Assisted Tomography, 14(5), 851-856.


