Diffusion Weighted Imaging (DWI MRI)/EPI DWI
Diffusion-weighted magnetic resonance imaging (DW MRI) provides image contrast that depends on the random microscopic motion of water protons, which can be substantially altered by different pathological processes.
Diffusion-weighted magnetic resonance imaging uses a T2-weighted pulse sequence with two extra gradient pulses of equal magnitude and opposite direction. These gradient pulses are applied between the nuclear spin excitation and data acquisition. As a result, the imaging is more sensitive to water molecular motion in the direction of the additional applied gradients. The extra gradient pulses lead to an attenuation of the signal intensity along the axis to which they are applied, which is directly proportional to water diffusion in that area. Higher water diffusion will result in greater signal attenuation and a darker appearance in the image. For instance, in brain scans, regions of ischemic infarction are characterized by reduced water diffusion due to reduced blood flow. Therefore, these areas appear hyperintense (bright) on diffusion-weighted images.
The magnitude of water signal attenuation on diffusion-weighted images depends on two factors: the translational movement of water molecules, and the amount of diffusion weighting. The latter varies based on the strength, duration, and separation time of the gradient pulses. The sensitivity to water diffusion is defined by the gradient factor “b” (sec/mm²). The higher the “b” values, the better the sensitivity of diffusion-weighted imaging (usually three to four “b” values are used in diffusion-weighted sequences: b50, b500, b1000, and b1400).
In addition to the diffusion-weighted raw data images, there is another way to present diffusion data known as the apparent diffusion coefficient (ADC) map of water. These maps are calculated from diffusion-weighted images after the acquisition.
MRI image appearance of DWI MRI scans
DWI (Diffusion-Weighted Imaging) images with b0 and b1000 values in MRI provide distinct information about tissue characteristics.
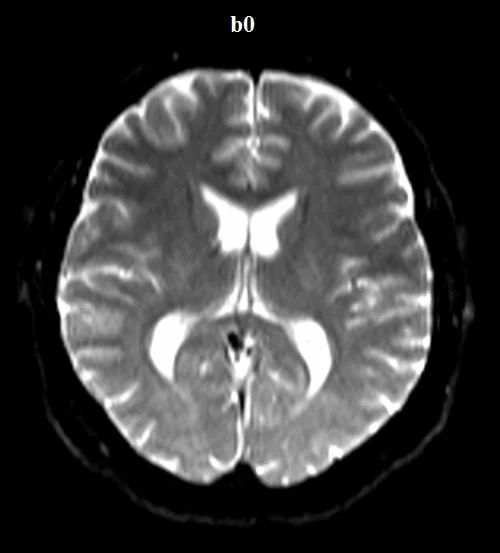
- b0 Image: The b0 image, often referred to as the “baseline” image, is acquired with no diffusion weighting. It captures the inherent signal intensity of tissues without directional sensitivity to water diffusion. In the b0 image, tissues appear with their natural signal intensity, resembling T2-weighted images. This image serves as a reference for comparison with diffusion-weighted images.
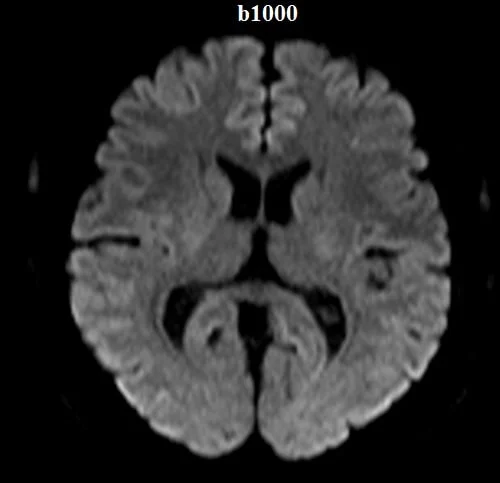
- b1000 Image: The b1000 image is acquired with higher diffusion weighting, making it more sensitive to water molecule movement. In regions where water diffusion is restricted or hindered, like cellular structures, the signal intensity on the b1000 image may appear hyperintense (bright). This effect is particularly prominent in areas with high cellularity, such as tumors or inflamed tissue, where restricted diffusion leads to elevated signal intensity.
The contrast between the b0 and b1000 images helps identify areas of altered tissue microstructure. Regions with higher signal intensity on the b1000 image compared to the b0 image can indicate restricted diffusion areas, potentially signifying pathology. This information is particularly valuable in fields like neurology and oncology, where DWI images assist in identifying conditions such as tumors, strokes, and hemorrhages based on tissue diffusion properties.
MRI image appearance Apparent Diffusion Coefficient (ADC) map
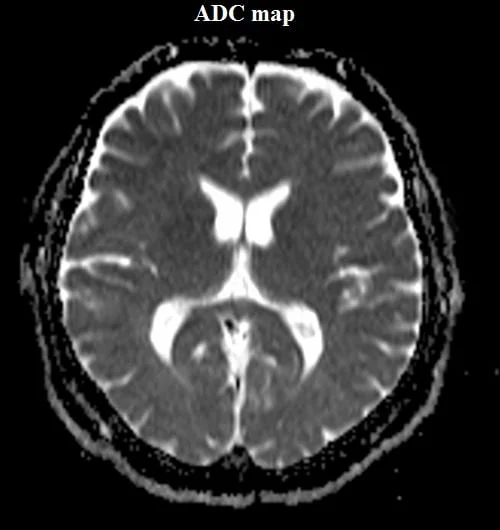
An Apparent Diffusion Coefficient (ADC) map is a specialized image that is crafted by utilizing data from diffusion-weighted magnetic resonance imaging (DW MRI). The ADC value corresponds to the apparent diffusion coefficient of water molecules in a given tissue, showcasing the pace at which these molecules disperse and traverse within the tissue. The movement of water molecules is impacted by factors like cell density, cellular obstacles, and tissue microstructure within biological tissues. This leads to a diversity of ADC values across different tissues and under varying conditions.
- High ADC Value Areas: In regions with high water diffusion, such as fluids or areas with fewer cellular structures, ADC values are high. On the ADC map, these areas typically appear brighter or lighter in color. For example, cerebrospinal fluid-filled spaces in the brain or cystic structures might exhibit high ADC values, appearing bright on the map.
- Low ADC Value Areas: Tissues with restricted water diffusion, often due to increased cellularity or compactness, have low ADC values. On the ADC map, these areas appear darker. Strokes, tumors, areas of inflammation, and regions with cellular proliferation might have lower ADC values, reflecting reduced water mobility.

Pathological appearance in DWI MRI
Diffusion-Weighted Imaging (DWI) in MRI can reveal specific pathological appearances in various medical conditions due to its sensitivity to the movement of water molecules within tissues. Here are some examples of how different pathologies can appear on DWI MRI:
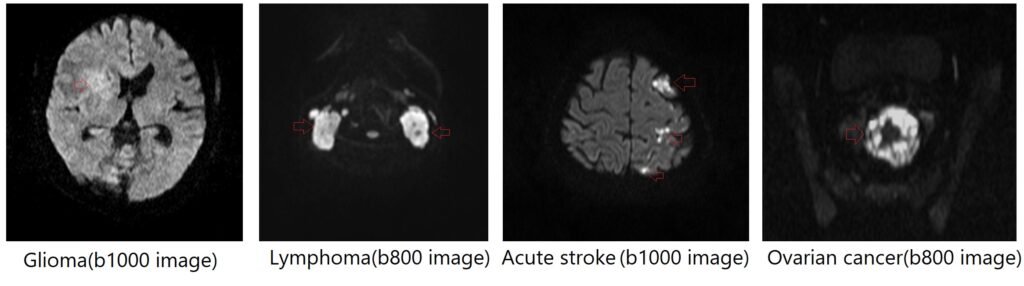
Acute Ischemic Stroke: In ischemic stroke, where there’s a lack of blood flow to a part of the brain, the affected area will show restricted diffusion due to cellular swelling and decreased movement of water molecules. This appears as a hyperintense (bright) region on DWI, indicating decreased diffusion and higher signal intensity.
Brain Abscess: In a brain abscess, a localized infection with pus formation, the center of the abscess will typically appear as a hyperintense area on DWI due to restricted diffusion caused by the high viscosity of pus. The surrounding edema might also show increased signal due to disrupted tissue microstructure.
Brain Tumors: Different types of brain tumors can show varying appearances on DWI. Generally, tumors with high cellularity, such as gliomas, might exhibit restricted diffusion and appear hyperintense on DWI. This can help differentiate between tumor tissue and the surrounding normal brain tissue.
Multiple Sclerosis (MS) Lesions: MS lesions, which involve inflammation and demyelination in the central nervous system, can show varying appearances on DWI depending on their stage and characteristics. Active lesions might appear hyperintense due to inflammation and restricted diffusion, while chronic lesions might show hypointensity due to decreased cellularity.
Acute Trauma: In cases of acute traumatic brain injury, such as contusions or hemorrhages, DWI can show areas of restricted diffusion corresponding to the injured tissue. Hemorrhagic regions might show hyperintensity due to the presence of blood products and disrupted tissue integrity.
Lymphomas and Metastases: Some tumors like lymphomas and metastatic lesions might demonstrate hyperintensity on DWI due to their increased cellularity. However, the appearance can vary based on the tumor type, size, and location.
Different Pathological Appearances in Diffusion-Weighted Imaging (DWI)
Use of DWI MRI
- Very useful for Diffusion-weighted whole-body cancer screening
- Very useful for brain imaging
- Very useful for cholesteatoma imaging
- Very useful for prostate imaging
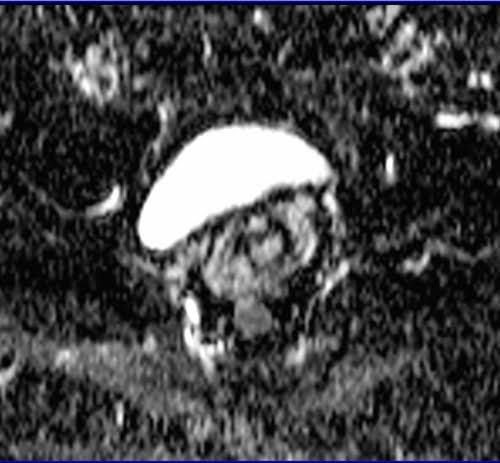
- Very useful for gynecology imaging
- Very useful for breast imaging
- Useful for anterior neck imaging
- Useful for small bowel imaging
- Useful for liver imaging
- Useful for spine imaging
- Useful for sacroiliac joint imaging
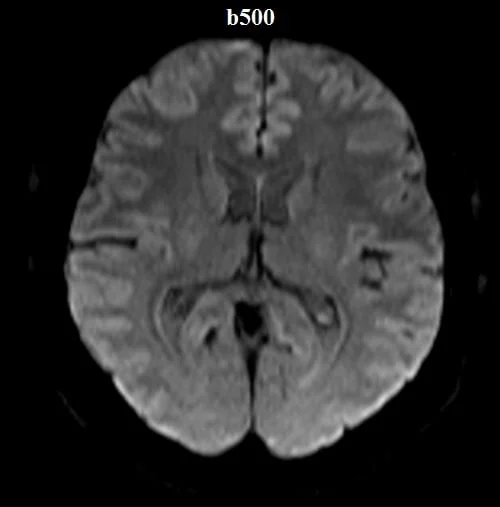
Diffusion-weighted (DWI) axial sequences with b-factors of b0, b500, and b1000 are used in brain imaging.
b-value 0
b-value 500
b-value 1000
ADC map created from B0, B500, and B1000.
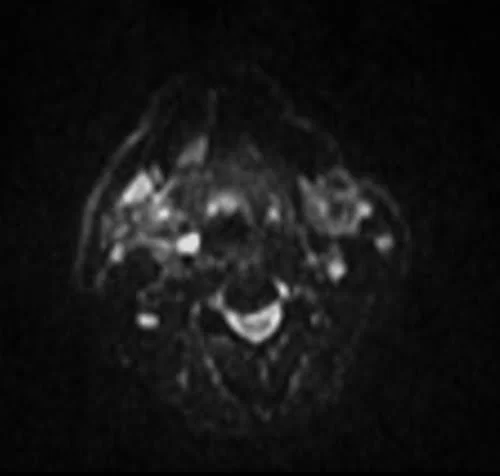
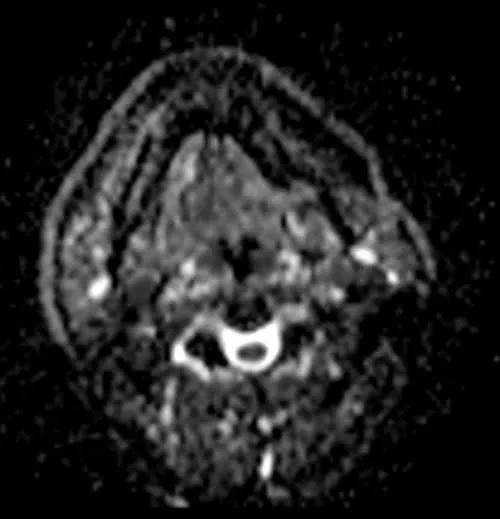
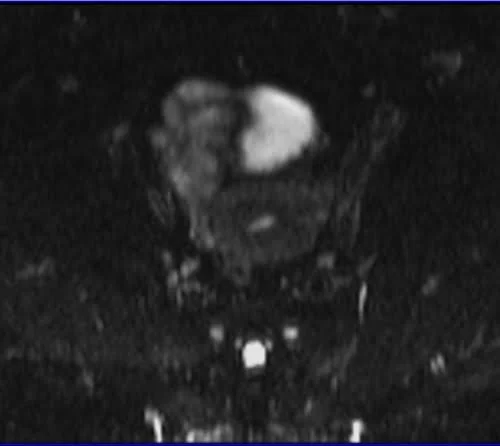
Diffusion-weighted (DWI) axial STIR sequence with a b-factor of B0 used in neck imaging.
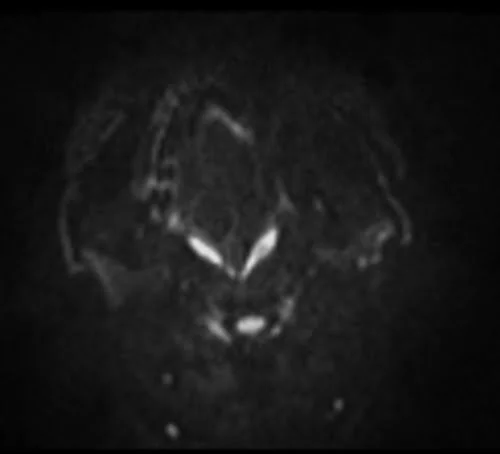
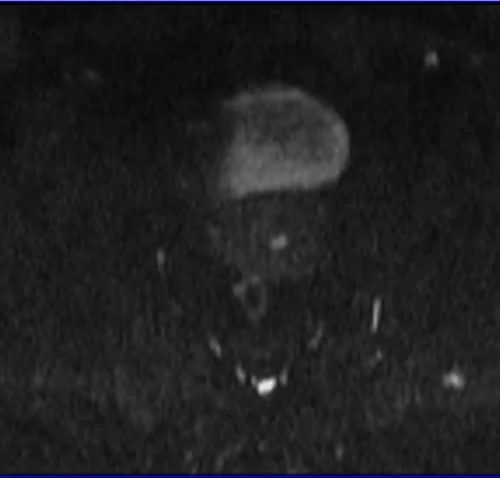
Diffusion-weighted (DW) axial STIR sequence with a b-factor of B800 used in neck imaging.
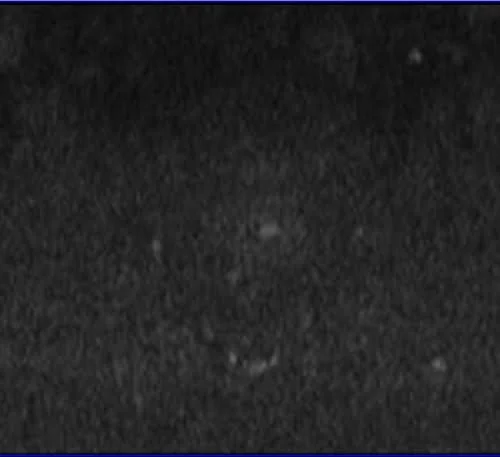
Neck ADC map of B0 AND B800
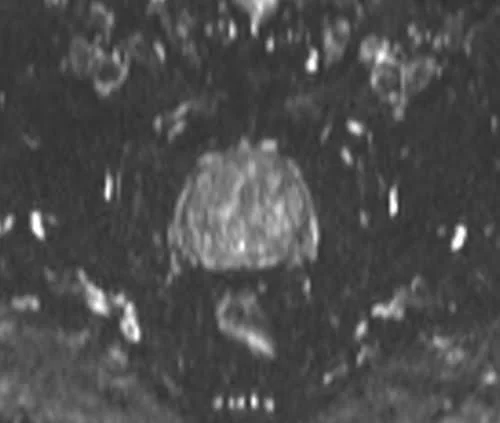
A diffusion-weighted (DW) axial fat-saturated sequence with b-factors of b0 is used in prostate imaging.
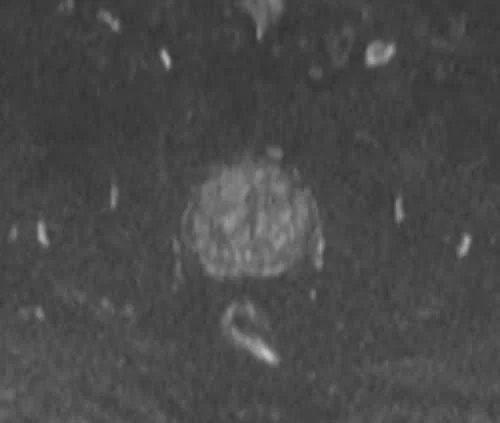
A diffusion-weighted (DW) axial fat-saturated sequence with b-factors of b500 is used in prostate imaging.
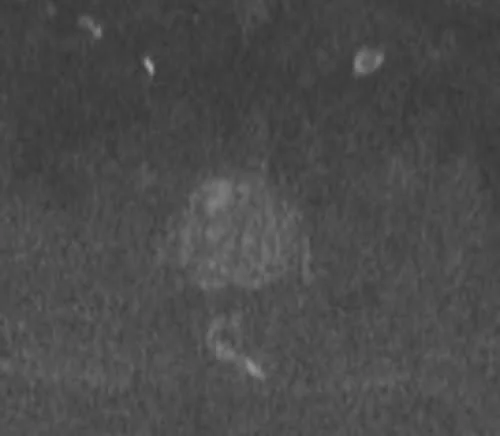
A diffusion-weighted (DW) axial fat-saturated sequence with b-factors of b1000 is used in prostate imaging.
ADC MAP OF B0,B500 AND 1000
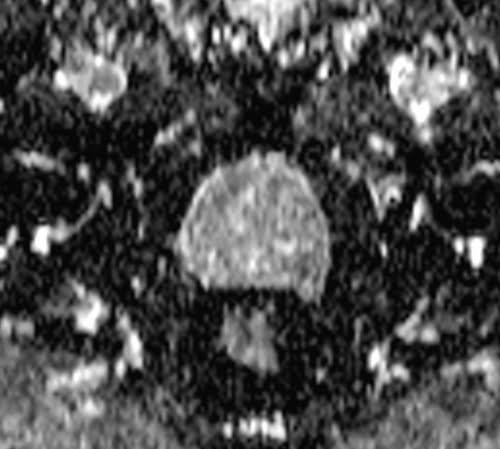
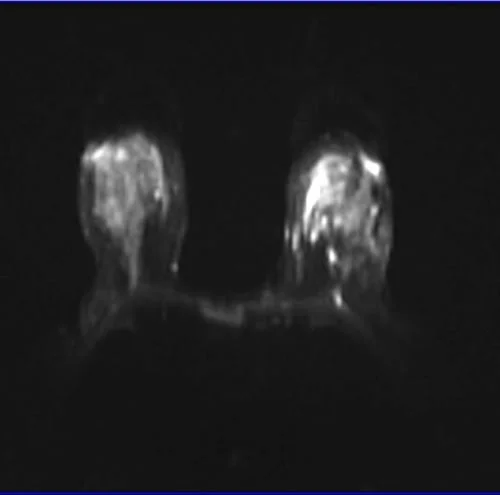
A diffusion-weighted (DW) axial fat-saturation sequence with b-factors of b0 is utilized in breast imaging.
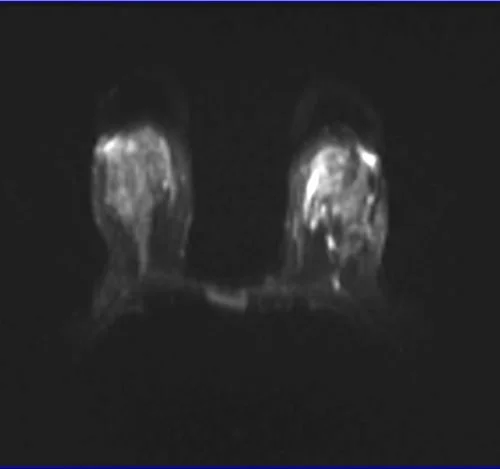
A diffusion-weighted (DW) axial fat-saturation sequence with b-factors of b500 is utilized in breast imaging.
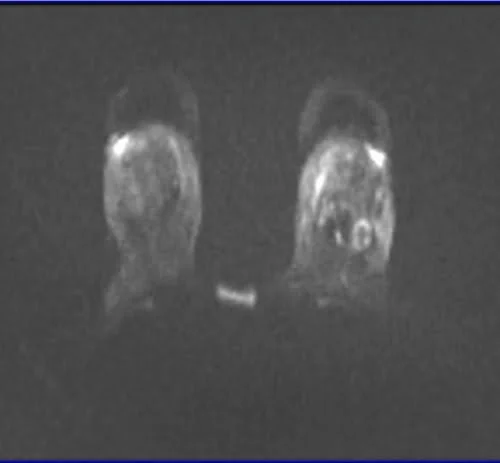
A diffusion-weighted (DW) axial fat-saturation sequence with b-factors of b1000 is utilized in breast imaging.
ADC MAP OF B0,B500 AND 1000

A diffusion-weighted (DW) axial fat-saturation sequence with b-factors of b0 is used in female pelvic imaging.
A diffusion-weighted (DWI) axial fat-saturation sequence with b-factors of b500 is used in female pelvic imaging.
A diffusion-weighted (DWI) axial fat-saturation sequence with b-factors of b1000 is used in female pelvic imaging.
ADC MAP OF B0,B500 AND 1000