MRI Specific Absorption Rate(SAR)
Specific Absorption Rate
SAR stands for Specific Absorption Rate and is a measure of the rate at which energy is absorbed by the body when exposed to radiofrequency (RF) electromagnetic fields during an MRI scan. SAR is typically expressed in units of watts per kilogram (W/kg).
During an MRI scan, the RF pulses used to excite the protons in the body can cause slight heating of the tissues. SAR quantifies the amount of RF energy absorbed by the body per unit mass over time. It is an important safety consideration in MRI to ensure that the amount of energy absorbed does not exceed safe limits and to prevent excessive tissue heating or potential adverse effects. While MRI is generally considered a safe imaging modality, excessive RF energy deposition can cause localized heating or burns. (Note: Nerve stimulation is mainly caused by rapidly changing gradient magnetic fields, not SAR.)
Generally, higher magnetic field strengths, such as those used in 3 Tesla MRI, may result in higher SAR values because SAR increases approximately with the square of the magnetic field strength (B₀²) due to increased RF frequency and power deposition.
In the United States, the FDA has established SAR limits for MRI scanning, which are based on exposure type and time rather than magnetic field strength. For example, the maximum whole-body average SAR is 4 W/kg averaged over 15 minutes, and for the head, it is 3.2 W/kg averaged over 10 minutes.
In Europe, the International Electrotechnical Commission (IEC 60601-2-33) has established similar limits. In the Normal Operating Mode, the maximum whole-body average SAR is 2 W/kg, and for the head, 3.2 W/kg, averaged over 6 minutes.

Factors Affecting Specific Absorption Rate (SAR)
Magnetic field strength:
SAR generally increases approximately with the square of the main magnetic field strength (B₀²). Therefore, higher magnetic field strengths, such as 3T and 7T, can result in higher SAR compared to 1.5T, because RF frequency and power deposition both increase with field strength.
Pulse sequence parameters:
The choice of pulse sequence and its specific parameters can significantly affect SAR. Sequences with high flip angles, short repetition times (TR), and multiple refocusing pulses (such as in fast spin echo or inversion recovery sequences) tend to have higher SAR. Echo time (TE) itself has little direct effect on SAR.
Patient size and position:
SAR can vary depending on the size and position of the patient in the scanner. Larger patients or those positioned closer to the transmit RF coil may experience higher RF power deposition, leading to increased SAR.
Tissue properties:
Tissue characteristics such as electrical conductivity and permittivity influence how much RF energy is absorbed. Tissues with higher conductivity and water content, such as muscle and internal organs, tend to absorb more RF energy than tissues with lower conductivity, such as fat or bone.
Coil design and placement:
The design and placement of the transmit RF coil affect SAR distribution. Whole-body transmit coils spread RF energy more evenly, while local transmit or multi-channel coils can concentrate energy in smaller regions, sometimes increasing local SAR but reducing overall body exposure. Receive-only coils do not contribute directly to transmit SAR.
Scanner hardware and software:
The specific hardware and software of the MRI scanner also influence SAR. Modern scanners equipped with technologies such as parallel imaging, RF shimming, and parallel transmit (pTx) can reduce both overall and localized SAR by optimizing RF power distribution, making them more efficient and safer than older systems.
How to reduce Specific Absorption Rate (SAR) in MRI:
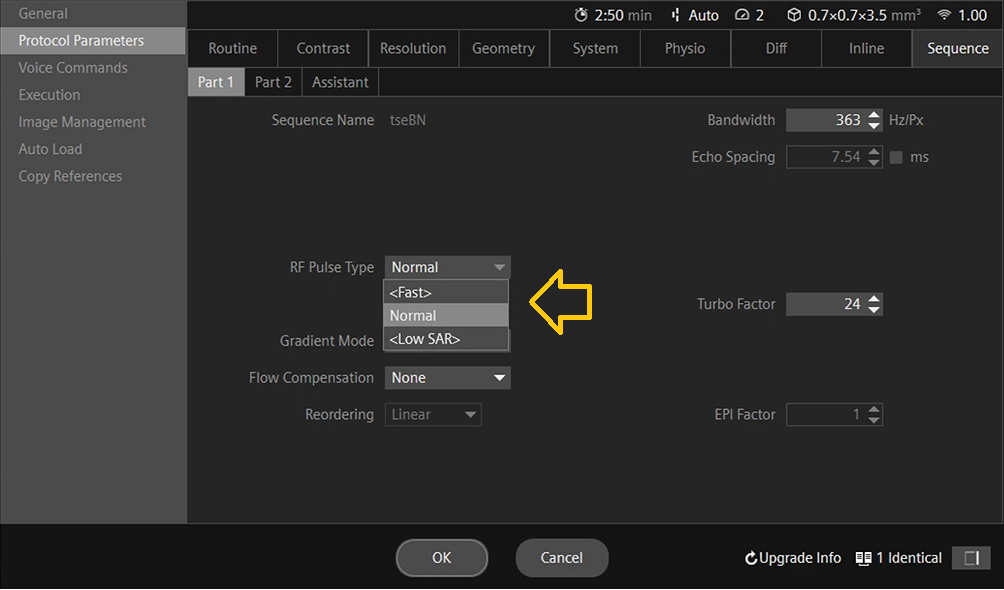
Change RF pulse type: Many MRI manufacturers provide options such as Fast, Normal, and Low SAR (or Low Power) pulse types. Selecting a Low SAR pulse typically increases the RF pulse duration and lowers its peak amplitude, which effectively reduces SAR. This adjustment also results in a narrower pulse bandwidth, which may slightly increase echo times (TE) or affect slice profiles.
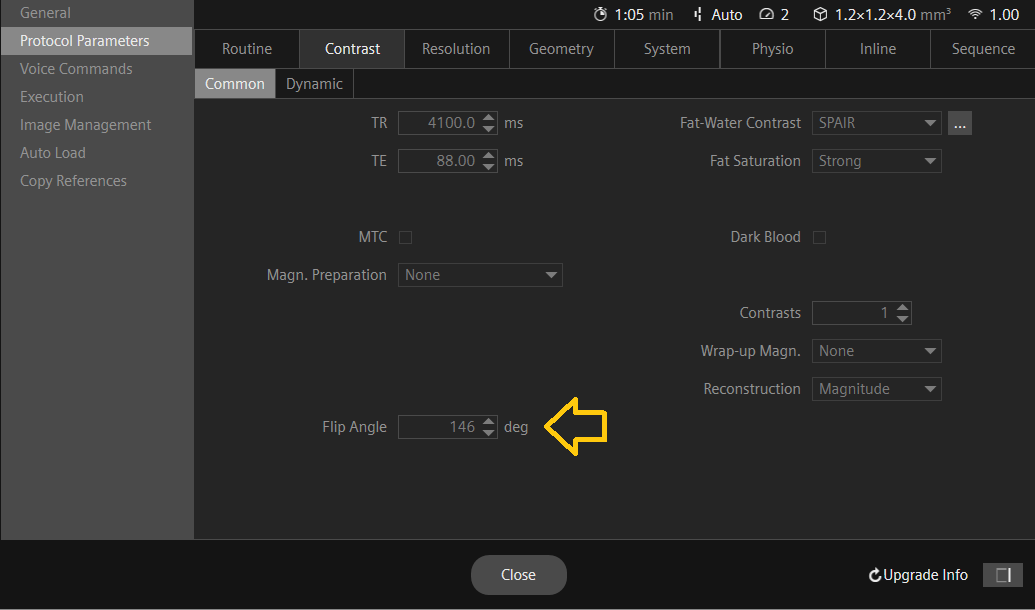
Reduce the flip angle: The flip angle is the angle at which the RF pulse is applied to the tissue. By reducing the flip angle, the amount of RF energy absorbed by the tissue can be reduced, which can in turn reduce SAR. However, reducing the flip angle may also reduce the signal-to-noise ratio (SNR) and image quality, so it should be done with caution.
Increase the TR: The repetition time (TR) is the interval between successive excitation pulses. Increasing the TR lengthens the time between RF excitations, reducing the number of pulses delivered per unit time. This decreases the RF duty cycle and therefore lowers the time-averaged SAR (W/kg). However, longer TR values may increase total scan time and alter image contrast due to greater T₁ relaxation between pulses.

Use a lower field strength:
SAR does not scale linearly with field; for the same sequence and flip angles it rises approximately with the square of B₀ (∝ B₀²). Using 1.5 T instead of 3 T can therefore reduce SAR by roughly a factor of ~4. This can also reduce SNR and alter contrast, so it may not be suitable for some applications.
Use a different coil:
Coil effects depend on transmit vs receive. Most exams use a body transmit coil with receive-only arrays; receive-only coils do not directly lower transmit SAR. Local transmit coils or parallel transmit (pTx) can redistribute RF and reduce whole-body or local hotspots, but poorly optimized settings can also increase local SAR. “Smaller coil = lower SAR” is not generally true for transmit.
Limit the scan time:
SAR is a rate (W/kg). Shortening scan time does not change the SAR value of a given sequence, but it reduces total energy/thermal dose and can help meet time-averaged limits. To actually lower SAR, change duty cycle (e.g., longer TR, fewer RF pulses, lower flip angles).
Use shorter pulse durations:
This is backwards. Shorter RF pulses require higher peak B₁, which typically increases SAR. To reduce SAR, use longer, lower-bandwidth (“low-SAR/low-power”) pulses when available (trade-offs: minimum TE/TR and slice profile).
Use time-interleaved acquisition:
Interleaving can reduce time-averaged SAR only if it effectively lengthens TR/reduces RF duty cycle (e.g., alternating modules or slice groups). It’s the duty-cycle reduction that helps; interleaving alone doesn’t guarantee lower SAR. (Note: some techniques like multiband SMS can increase SAR if RF power rises.)
Specific Absorption Rate (SAR) Calculations
Specific Absorption Rate (SAR) Calculations
Specific Absorption Rate (SAR) estimates can vary across MRI scanners depending on factors such as scanner model, field strength, RF coil design, imaging sequence, and software algorithms used for safety monitoring.
In MRI, SAR represents the rate at which RF energy is absorbed by tissue and is expressed in watts per kilogram (W/kg). The physical definition of SAR is:
$$ \mathrm{SAR} = \frac{\sigma \lvert E \rvert^{2}}{\rho} $$
where:
σ = electrical conductivity of the tissue (S/m)
|E| = root-mean-square (RMS) electric field strength (V/m)
ρ = tissue density (kg/m³)
MRI scanners do not calculate SAR directly from sequence parameters such as TR, TE, or FOV. Instead, each manufacturer uses proprietary models that combine:
- the measured RF power output (transmit power and duty cycle),
- the B1+ field amplitude and distribution,
- patient weight and loading, and
- coil geometry and sequence timing (flip angles, RF pulse shapes, etc.).
These parameters are used to estimate the whole-body, head, and local (partial-body) SAR. The system continuously monitors and limits transmitted RF power to ensure compliance with international safety standards (IEC 60601-2-33 and FDA guidelines).
Typical SAR values in clinical MRI:
- Whole body: 0.5 – 4.0 W/kg (depending on sequence and operating mode)
- Head: up to 3.2 W/kg
- Extremities: up to 12 – 20 W/kg
Because of the complexity of electromagnetic interactions, manual calculation of SAR is neither practical nor accurate. The scanner’s internal safety system provides real-time SAR monitoring and automatically enforces limits to prevent tissue overheating.
References
- Hayes, C. E., & Edelstein, W. A. (1987). Schenck JF, Mueller OM, Eash M. An efficient, highly homogeneous radiofrequency coil for whole-body NMR imaging at 1.5 T. Journal of Magnetic Resonance (1969), 73(1), 144-149.
- Collins, C. M., & Smith, M. B. (2001). Signal-to-noise ratio and absorbed power as functions of main magnetic field strength, and definition of “90 degrees” RF pulse for the head in the birdcage coil. Magnetic Resonance in Medicine, 45(4), 684-691.
- Kainz, W., Chen, J., Oberacker, E., & Kellom, T. (2009). Specific Absorption Rate (SAR) as an MRI safety parameter: applications, challenges and future directions. Magnetic Resonance Imaging, 27(3), 423-436.
- Lu, M., Börnert, P., Eggers, H., & Rasche, V. (2004). Noninvasive temperature mapping with MRI using a proton resonance frequency technique: feasibility study in pigs. Magnetic Resonance in Medicine, 51(5), 1060-1065.
- Collins, C. M., & Liu, W. (2018). The effects of RF coil excitation on MRI: A review of the basic physics and considerations for human brain imaging. eMagRes, 7(2), 43-61.
- Atalar, E., & Hardy, C. J. (1991). Accuracy of the temperature measurement using the proton resonance frequency shift technique. Journal of Magnetic Resonance Imaging, 1(4), 446-454.
- Zollner, F. G., & Gleich, B. (2008). SAR and power implications of parallel transmission. NMR in Biomedicine, 21(9), 904-918.
- Collins, C. M., & Smith, M. B. (2001). SAR and B1 field distributions in a heterogeneous human head model within a birdcage coil. Magnetic Resonance in Medicine, 45(3), 434-438.
Note ****
The SAR calculations provided above are for illustrative purposes only and should not be used for calculating the SAR during scanning. These values can vary depending on the scanner and software used. For accurate values, please refer to the manufacturer’s guide and consult with an MRI physicist.