T1 vs T2 vs PD vs FLAIR MRI: Physics and Image Comparison
In the field of magnetic resonance imaging (MRI), it is crucial to have a comprehensive understanding of the four primary MRI sequences. These sequences, known as T1-weighted (T1), T2-weighted (T2), Proton Density (PD), and Fluid-Attenuated Inversion Recovery (FLAIR), are fundamental for achieving precise diagnoses in medical imaging. Each sequence provides a distinct view of the human body, offering valuable insights.
T1-Weighted Imaging (T1 MRI)
T1-weighted images are a type of MRI (Magnetic Resonance Imaging) scan commonly used in medical imaging. In these images, the contrast is primarily determined by the longitudinal relaxation time (T1) of the tissues. T1 relates to how quickly the nuclei of hydrogen atoms in the body return to their equilibrium state after being disturbed by an external magnetic pulse. Different tissues have distinct T1 relaxation times, resulting in varying signal intensities in the image. T1-weighted images generally display anatomy with fluid appearing dark and fatty tissues appearing bright, making them useful for visualizing anatomical structures and certain pathologies.
The contrast in T1-weighted sequences is mainly controlled by the Repetition Time (TR) and Echo Time (TE) values. To achieve this, a short TR, typically ranging from 400 to 700 ms, is chosen to ensure that tissues with different T1 relaxation times recover differently between successive RF pulses. Additionally, a short TE, usually less than 30 ms, is selected to minimize the impact of T2 relaxation effects. These parameters are fine-tuned to effectively highlight tissues with shorter T1 relaxation times, such as fat, making them appear brighter compared to other tissues.
Read more about T1 in our dedicated T1 MRI section.
T1 MRI Image Appearance of Various Structures in the Brain
- Fat: Bright
- CSF : Dark
- Muscle: Intermediate
- White Matter: Intermediate to bright
- Gray Matter: Slightly darker than white matter
- Bone: Dark
- Bone Marrow: Bright (due to fatty content in adults)
- Blood Vessels: Mostly Dark, Depending on flow characteristics, can be bright or dark
- Pituitary Gland: Intermediate.
- Choroid Plexus: Intermediate to bright
- Cerebellum (consists of both white and gray matter): Gray matter darker than white matter
- Brain Stem: Intermediate
- Sinuses: Dark (filled with air)
- Thalamus: Intermediate, similar to gray matter
- Putamen: Intermediate, similar to gray matter
- Pineal Gland: Intermediate
- Hippocampus: Intermediate, similar to gray matter
- Corpus Callosum: Intermediate to bright
- Caudate Nucleus: Intermediate, similar to gray matter
T1 MRI Image of the Brain

T2-Weighted Imaging (T2 MRI)
T2-weighted MRI (Magnetic Resonance Imaging) is another common type of MRI sequence frequently used in medical imaging. These images emphasize the T2 relaxation time of tissues, indicating the duration taken for hydrogen nuclei to lose phase coherence among neighboring spins after a radiofrequency disturbance. Different tissues exhibit varying T2 relaxation times, resulting in a range of signal intensities in the image. Typically, in T2-weighted images, fluid-containing structures such as edema or cerebrospinal fluid appear bright.
The image contrast in T2-weighted sequences is predominantly controlled by the Repetition Time (TR) and Echo Time (TE) values. A long TR, typically greater than 2000 ms, allows ample time for longitudinal magnetization recovery between subsequent RF pulses, ensuring minimal T1 contrast. Meanwhile, a longer TE, typically ranging from 60 to 120 ms, is selected to capture the signal when differences in T2 relaxation times between tissues are most pronounced. By using these parameters, T2-weighted images provide clear visualization of tissues with prolonged T2 relaxation times, such as fluid-filled regions.
Read more about T2 in our dedicated T2 MRI section.
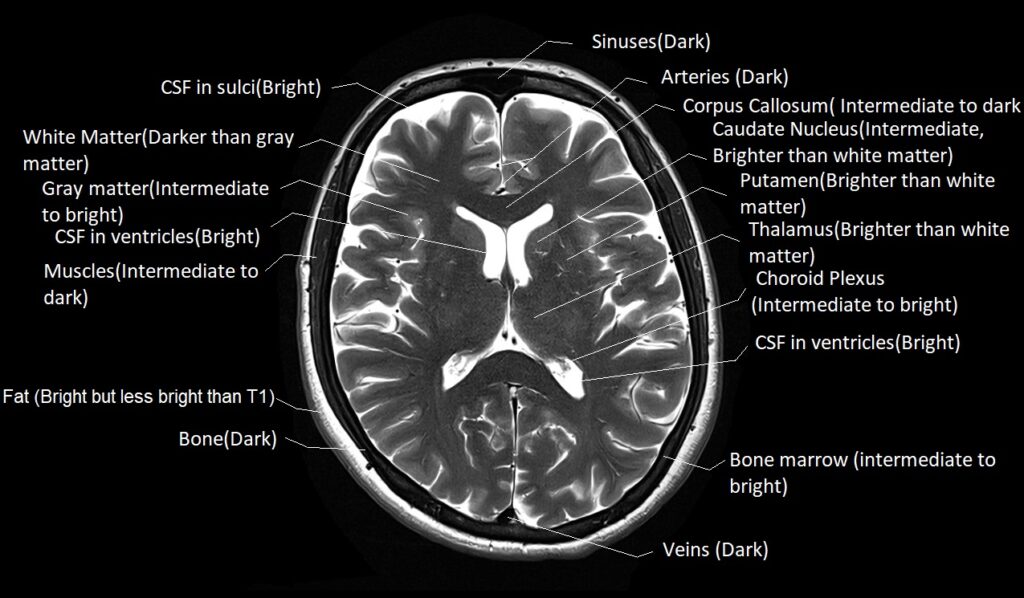
T2 MRI Image Appearance of Various Structures in the Brain
- Fat: Very bright
- CSF: Intermediate to bright
- Muscles: Intermediate to Dark.
- White Matter: Darker than gray matter
- Gray Matter: Intermediate to bright
- Bone: Dark (low signal)
- Bone Marrow: Variable but often bright
- Blood Vessels: Mostly Dark, Depending on flow characteristics, can be bright or dark
- Pituitary Gland: Intermediate Choroid Plexus: Intermediate to bright
- Cerebellum (consists of both white and gray matter): Gray matter brighter than white matter
- Brain Stem: Intermediate
- Sinuses: Dark (filled with air)
- Thalamus: Brighter than white matter
- Putamen: Brighter than white matter
- Pineal Gland: Intermediate
- Hippocampus: Brighter than white matter
- Corpus Callosum: Intermediate to Dark
- Caudate Nucleus: Brighter than white matter
T2 MRI Image of the Brain
Proton Density (PD) Weighted Imaging (PD MRI)
Proton Density (PD)-weighted MRI (Magnetic Resonance Imaging) is another common type of MRI sequence used in medical imaging. These images emphasize the concentration of hydrogen protons in tissues without heavily weighting for T1 or T2 relaxation times. The resulting contrast is primarily determined by the inherent proton density of the tissues. On PD-weighted scans, fluid structures often appear with intermediate intensity. These images provide a more “neutral” view of tissues, highlighting intrinsic anatomical differences. They are particularly useful for visualizing subtle pathologies, such as meniscal tears in the knee, by leveraging the natural contrast of tissue proton densities.
The contrast in PD weighted images is primarily determined by two main sequence parameters: Repetition Time (TR) and Echo Time (TE). For PD-weighted MRI sequences, a long TR is used, often exceeding 2000 ms, which ensures near-complete relaxation of longitudinal magnetization between subsequent pulses. Meanwhile, a short TE, usually less than 20 ms, is chosen to minimize T2 contrast and capture the signal before significant transverse relaxation occurs. This combination of long TR and short TE maximizes the visibility of inherent proton density differences among tissues.
Read more about PD in our dedicated PD MRI section.
PD MRI Image Appearance of Various Structures in the Brain
- Fat: Very bright (The signal is typically quite high on PD sequences).
- CSF: Intermediate to bright.
- Muscles: Intermediate to Dark.
- White Matter: Darker than gray matter.
- Gray Matter: Intermediate to bright.
- Bone: Dark (low signal).
- Bone Marrow: Variable but often bright.
- Blood Vessels: Mostly Dark, Depending on flow characteristics, can be bright or dark.
- Pituitary Gland: Intermediate. Choroid Plexus: Intermediate to bright.
- Cerebellum (consists of both white and gray matter): Gray matter brighter than white matter.
- Brain Stem: Intermediate.
- Sinuses: Dark (filled with air).
- Thalamus: Brighter than white matter.
- Putamen: Brighter than white matter.
- Pineal Gland: Intermediate.
- Hippocampus: Brighter than white matter.
- Corpus Callosum: Intermediate to Dark.
- Caudate Nucleus: Brighter than white matter.
PD MRI Image of the Brain

Fluid Attenuated Inversion Recovery (FLAIR) MRI Imaging
Fluid Attenuated Inversion Recovery Magnetic Resonance Imaging (FLAIR) is a specialized medical imaging technique that enhances the detection of brain and spinal cord abnormalities. It’s designed to suppress the signal from cerebrospinal fluid (CSF), making lesions in the brain and spinal cord, such as multiple sclerosis plaques, more discernible. The technique involves an inversion recovery pulse to nullify the CSF signal, followed by a delay and then T2-weighted image acquisition. The result is an image where fluid appears dark, while pathological alterations in nearby tissue stand out with increased contrast. This unique enhancement ensures that abnormalities, often obscured by the bright fluid signal in other sequences, become more conspicuous and readily identifiable.
For FLAIR imaging, three pivotal parameters determine image contrast: Inversion Time (TI), Repetition Time (TR), and Echo Time (TE). TI is carefully chosen to nullify the CSF signal. FLAIR sequences typically employ a long TR (often exceeding 6000 ms) to ensure complete longitudinal magnetization recovery. The TE falls within the mid to high range, often around 100 ms. A specific TI value, usually between 2000 and 2500 ms, is selected to effectively suppress the CSF signal.
Read more about MRI FLAIR in our dedicated MRI FLAIR section.
FLAIR MRI Image Appearance of Various Structures in the Brain
- Fat: Bright.
- CSF: Dark.
- Muscles: Intermediate to Dark.
- White Matter: Intermediate to dark.
- Gray Matter: Intermediate to bright.
- Bone (skull): Dark.
- Muscles:Intermediate to dark.
- Bone Marrow: Intermediate to bright.
- Blood Vessels: Mostly Dark; Depending on flow characteristics, can be bright or dark
- Pituitary Gland: Intermediate.
- Choroid Plexus: Intermediate.
- Cerebellum: Gray matter Brighter than white matter.
- Brain Stem: Intermediate.
- Sinuses: Dark (air-filled).
- Thalamus, Hippocampus, Caudate Nucleus: Intermediate.
- Putamen: Intermediate to dark
- Corpus Callosum: Intermediate.
- Pineal Gland: Intermediate.
FLAIR MRI Image of the Brain

References
- Pirkl, C. M., Nunez-Gonzalez, L., Kofler, F., Endt, S., Grundl, L., Golbabaee, M., … Hernandez-Tamames, J. A. (2021). Accelerated 3D whole-brain T1, T2, and proton density mapping: feasibility for clinical glioma MR imaging. Diagnostic Neuroradiology, 63, 1831–1851. doi
- Paniagua Bravo, Á., Sánchez Hernández, J. J., Ibáñez Sanz, L., Alba de Cáceres, I., Crespo San José, J. L., & García-Castaño Gandariaga, B. (Year). A comparative MRI study for white matter hyperintensities detection: 2D-FLAIR, FSE PD 2D, 3D-FLAIR, and FLAIR MIP. The British Journal of Radiology, 87(1035)
- Tubridy, N., Molyneux, P. D., Moseley, I. F., & Miller, D. H. (1999). The sensitivity of thin-slice fast spin echo, fast FLAIR, and gadolinium-enhanced T1-weighted MRI sequences in detecting new lesion activity in multiple sclerosis. Journal of Neurology, 246(12), 1181–1185. doi:10.1007/s004150050488
- Chong, A.L., Chandra, R.V., Chuah, K.C., Roberts, E.L., & Stuckey, S.L. (2016). Proton Density MRI Increases Detection of Cervical Spinal Cord Multiple Sclerosis Lesions Compared with T2-Weighted Fast Spin-Echo. AJNR Am J Neuroradiol, 37(1), 180–184. doi: 10.3174/ajnr.A4476. PMID: 26427838. PMCID: PMC7960196.
- Knight, M. J., McCann, B., Tsivos, D., Couthard, E. C., & Kauppinen, R. A. (2016). Quantitative T1 and T2 MRI signal characteristics in the human brain: different patterns of MR contrasts in normal ageing. MAGMA (New York, N.y.), 29(6), 833–842.
- Schwer, A., McCammon, R., Kavanagh, B., Gaspar, L., Damek, D., & Chen, C. (2007). Magnetic Resonance Imaging (MRI) T1 and T2 Volumetric Changes and their Implications after Hypofractionated Stereotactic Radiotherapy (SRS) in Patients with Recurrent Malignant Gliomas. Poster Discussion Presentation, International Journal of Radiation Oncology, Biology, Physics, 69(3), Supplement, S167.
- van Gastel, M.D.A., Messchendorp, A.L., Kappert, P., Kaatee, M.A., de Jong, M., Renken, R.J., ter Horst, G.J., Mahesh, S.V.K., & Gansevoort, R.T. (2018). T1 vs. T2 weighted magnetic resonance imaging to assess total kidney volume in patients with autosomal dominant polycystic kidney disease. Abdominal Radiology, 43(10), 1215–1222. doi:10.1007/s00261-017-1269-0
- Haacke, E. M., Brown, R. W., Thompson, M. R., & Venkatesan, R. (1999). Magnetic resonance imaging: Physical principles and sequence design. John Wiley & Sons.
- Hennig, J., Nauerth, A., & Friedburg, H. (1986). RARE imaging: a fast imaging method for clinical MR. Magnetic resonance in medicine, 3(6), 823-833.
- Edelman, R. R., Hesselink, J. R., Zlatkin, M. B., & Crues, J. V. (2006). Clinical magnetic resonance imaging (Vol. 1). WB Saunders.