Proton Density (PD) MRI
When an MRI sequence is set to produce a PD-weighted image, the tissues with a higher concentration or density of protons (hydrogen atoms) generate the strongest signals and appear the brightest in the image. The proton density-weighted sequence produces contrast mainly by minimizing the impact of T1 and T2 differences, using a long TR (2000-5000 ms) and a short TE (10-20 ms).
Proton Density MRI Image Appearance
The easiest way to identify PD-weighted images is to compare the fluid signal against the fat signal. Fluids typically appear as a grayish-white color, with an appearance almost similar to the fat in the body.
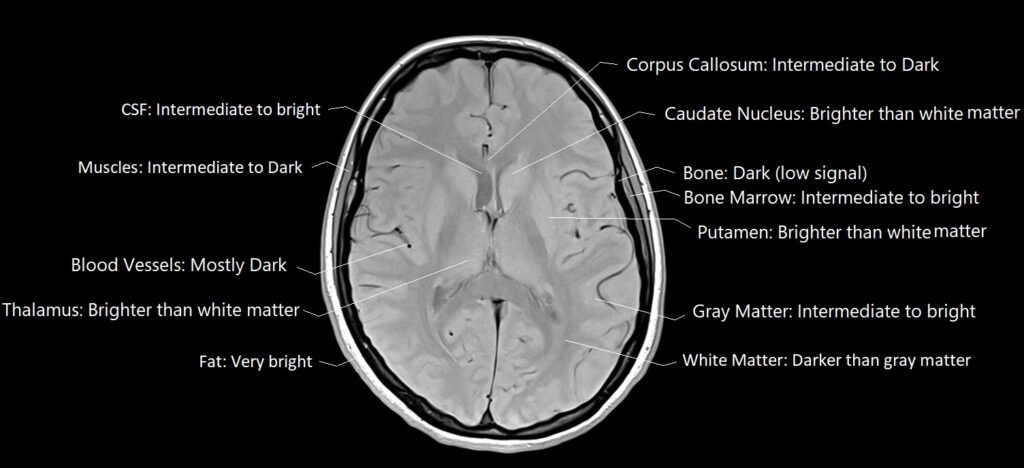
Proton Density(PD) MRI Image Appearance of Various Structures in the Brain
Brain Tissues PD appearance
- Fat: Very bright (The signal is typically quite high on PD sequences).
- Muscles: Intermediate to Dark.
- CSF: Intermediate to bright.
- White Matter: Darker than gray matter.
- Gray Matter: Intermediate to bright.
- Bone: Dark (low signal).
- Bone Marrow: Variable but often bright.
- Blood Vessels: Mostly Dark, Depending on flow characteristics, can be bright or dark.
- Pituitary Gland: Intermediate. Choroid Plexus: Intermediate to bright.
- Cerebellum (consists of both white and gray matter): Gray matter brighter than white matter.
- Brain Stem: Intermediate.
- Sinuses: Dark (filled with air).
- Thalamus: Brighter than white matter.
- Putamen: Brighter than white matter.
- Pineal Gland: Intermediate.
- Hippocampus: Brighter than white matter.
- Corpus Callosum: Intermediate to Dark.
- Caudate Nucleus: Brighter than white matter.
Use of PD
- Very useful for brain imaging (because of great White matter Gray matter contrast)
- Useful for extremity imaging (e.g. ankle, knee, elbow shoulder and hips)
- Can be useful in thighs, lower legs, upper arms and forearms imaging
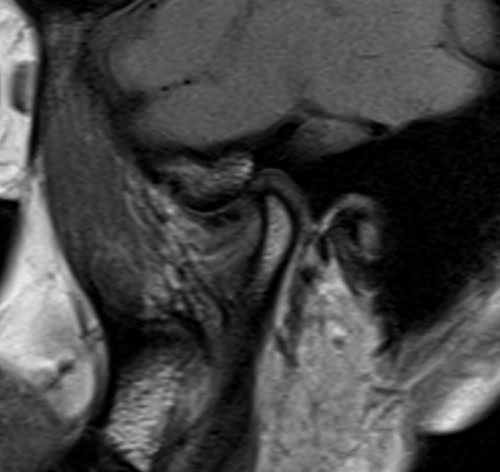
- Very useful for temporomandibular joint imaging
Proton Density(PD) MRI Image of the Brain
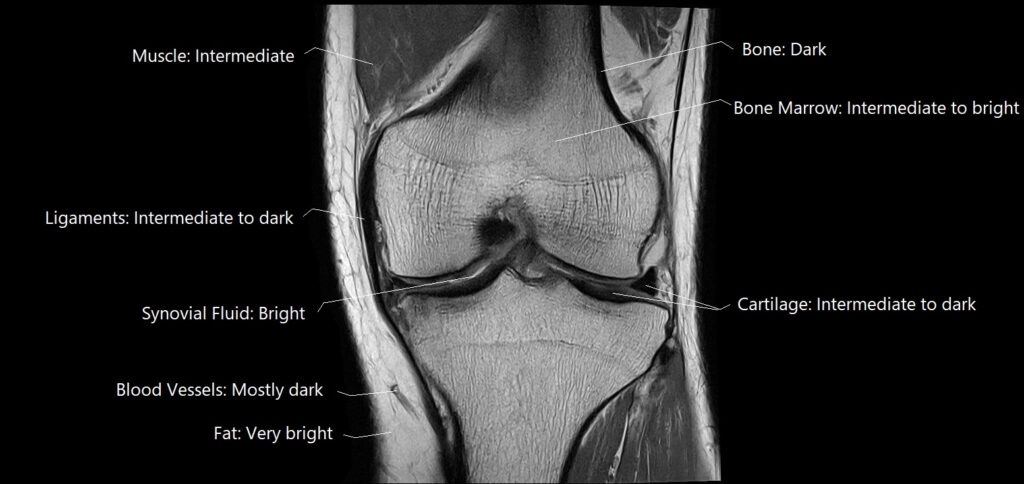
Proton Density(PD) MRI Image Appearance of Various Structures in the Knee\ Other Joints
Knee Tissues PD appearance
- Muscle: Intermediate.
- Bone: Dark (low signal).
- Bone Marrow: Intermediate to bright.
- Blood Vessels: Mostly dark; however, depending on flow characteristics, they can appear bright or dark.
- Fat: Very bright (The signal is typically quite high on PD sequences).
- Ligaments: Intermediate to dark.
- Nerve Roots: Intermediate signal.
- Cartilage: Intermediate to dark (Note: Healthy cartilage generally has an intermediate to dark signal, but damaged or degraded cartilage might show signal changes).
- Synovial Fluid: Bright (Fluids, in general, appear intermediate to bright on PD sequences).
- Tendons: Intermediate to dark.
Use of PD
- Very useful for brain imaging (because of great White matter Gray matter contrast)
- Useful for extremity imaging (e.g. ankle, knee, elbow shoulder and hips)
- Can be useful in thighs, lower legs, upper arms and forearms imaging
- Very useful for temporomandibular joint imaging
Proton Density(PD) MRI Image of the Knee
Pathology appearance on PD Images
Various pathological conditions can display distinct appearances in Proton Density (PD) MRI images due to differences in tissue composition, water content, and proton density. Here are some examples of how different pathologies might manifest on PD images:
Edema:
- Areas of edema, characterized by increased fluid accumulation in tissues, may exhibit brighter appearances on PD images due to higher water content. This heightened signal can indicate inflammation or tissue injury.
Cysts:
- Cysts, fluid-filled sacs, can appear as bright or light grey areas in PD images, owing to their fluid content.
Tumors:
- Solid tumors can showcase varying signal intensities on PD images contingent on their composition. Tumors with a substantial cellular component might appear with intermediate signal intensity, while areas of necrosis or hemorrhage might present differently.
Inflammatory Conditions:
- Inflammatory processes can lead to augmented water content and altered tissue properties. Changes related to inflammation might yield brighter signal intensities on PD images.
Degenerative Changes:
- Degenerated tissues, such as cartilage in osteoarthritic joints, might display altered signal intensities on PD images due to shifts in tissue composition and water content.
Tendon and Ligament Pathologies:
- Conditions affecting tendons and ligaments, like tears or inflammation, can induce shifts in tissue properties. These alterations might be discernible through modified signal intensities on PD images.
Synovial Pathologies:
- Disorders impacting synovial tissue within joints, such as synovitis, could lead to changes in water content and inflammation. Such changes might culminate in signal intensity variations on PD images.
Bone Marrow Changes:
- Pathological conditions in bone marrow, such as marrow infiltration due to cancer, might impact proton density and water content, resulting in signal intensity alterations.
Nerve Pathologies:
- Nerve-related disorders, including nerve compression or inflammation, may induce shifts in water content and tissue properties, potentially appearing bright on PD images.
PD sagittal sequence used in knee imaging

PD coronal sequence used in knee imaging

PD SAGITTAL SEQUENCE USED IN TMJS IMAGING
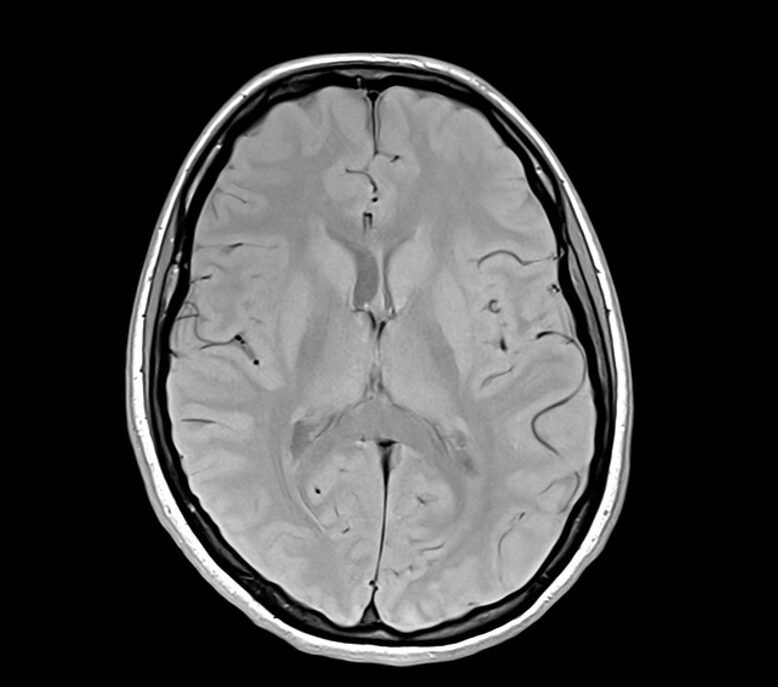
PD Axial sequence used in brain imaging
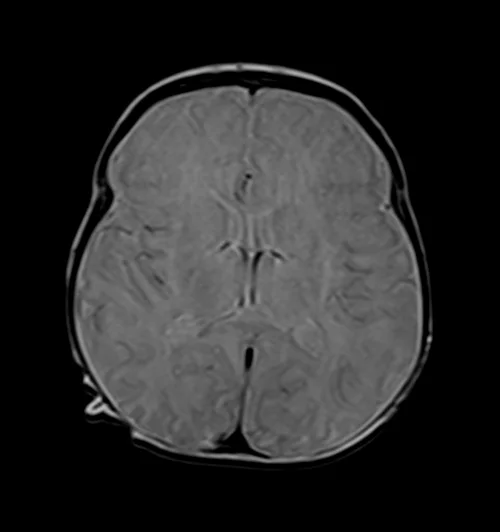
PD Axial sequence used in pediatric brain imaging
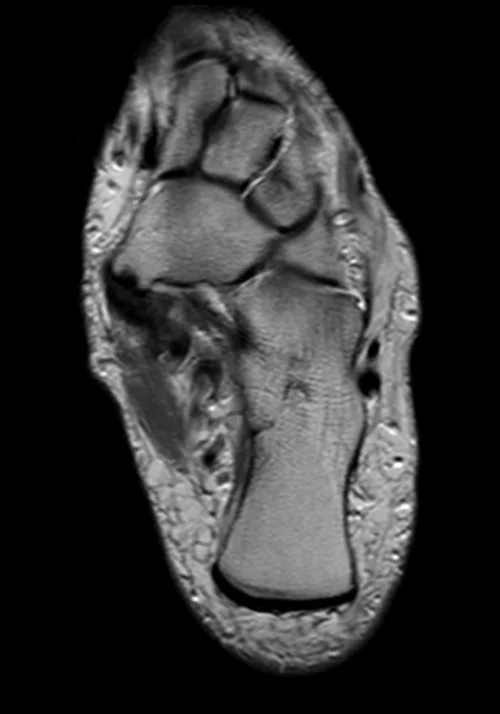
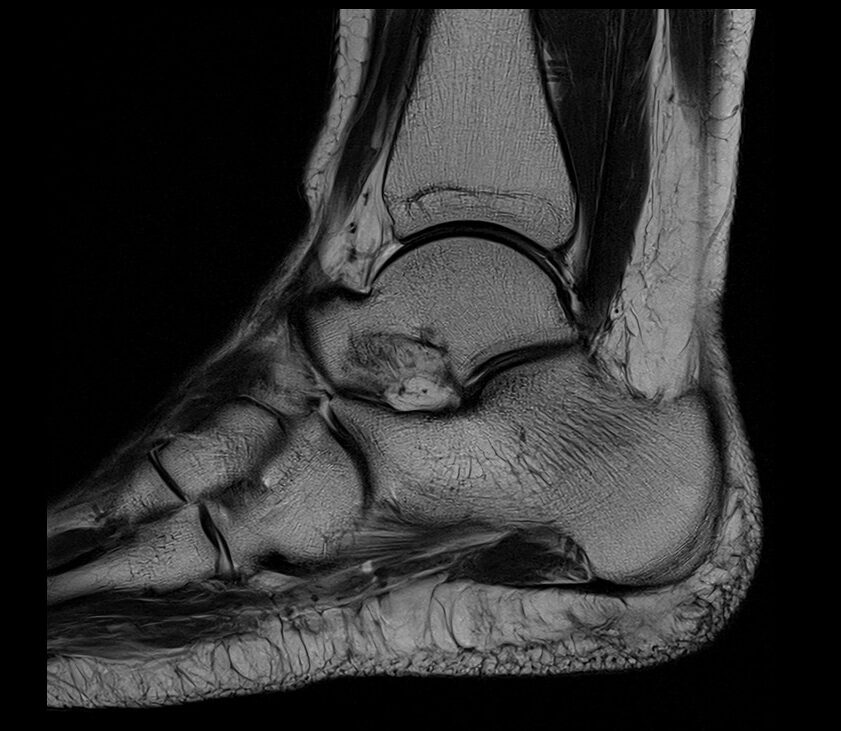
PD Sagittal SEQUENCE USED IN ANKLE IMAGING
PD AXIAL SEQUENCE USED IN ANKLE IMAGING