MRI Signal-to-Noise Ratio (SNR) and Image Quality
Introduction
The Signal-to-noise ratio (SNR) serves as a benchmark for evaluating the efficacy of an MRI system. An MRI image is not created by pure MRI signals, but from a combination of MRI signals and unavoidable background noise
MRI Image = Signal + Noise
The presence of noise within an MRI image does not provide valuable information for image creation. Instead, it stems from the random variations in signal intensity, often manifesting as grain-like or uneven patterns.
Noise in MRI is from two main sources
1. Molecular movement - charged particles in the human body create electromagnetic noise
2. Electrical resistance - resistance from the receiver coils, data cables and the electronic components of the measurement system
Noise produced in the MRI image depends on
1. The coil - the number of elements, type and size and of the coil e.g. 8-channel body coil, 4-channel flex coil
2. Bandwidth - differs in each pulse sequence
Factors Affecting Signal-to-Noise Ratio (SNR)
In MRI, SNR is primarily used for image evaluation and contrast enhancement measurement. Additionally, SNR is employed for tasks such as quality assurance, pulse sequence comparison, and radiofrequency (RF) coil assessment.
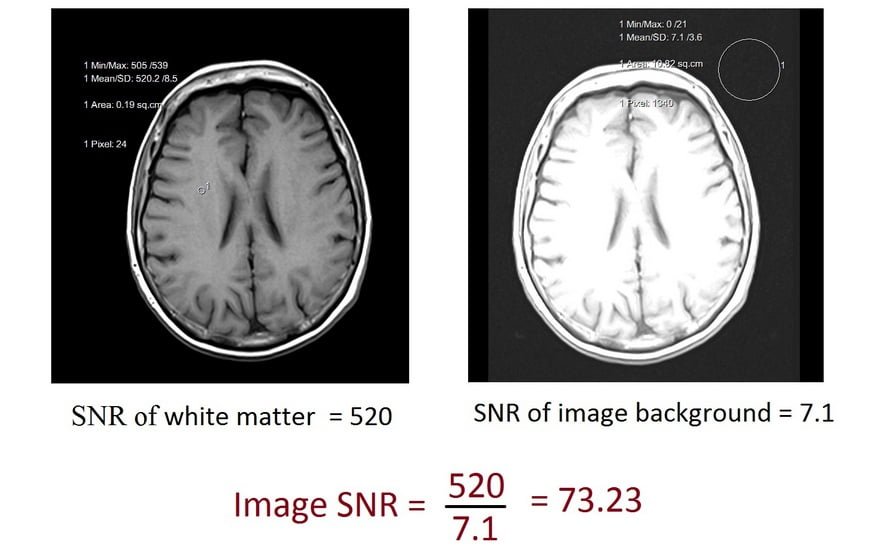
Several methods are available to measure SNR. The most common method involves measuring the signals from two distinct regions within a single image and then applying a formula. Most MRI systems offer a region of interest (ROI) option in their image processing section for signal intensity measurement. To measure SNR in an image, begin by placing the first ROI on tissues exhibiting the most homogenous area and the highest signal intensity. Record the signal intensity values from this region. Next, position the second ROI (with the largest feasible size to encompass maximum noise) outside the tissue area, in the noisy background of the image. Record the signal intensity values from this region as well. The image SNR can be calculated using the following formula: SNR = signal / noise
For instance, consider a T1 axial brain image. In this case, the signal intensity of the white matter and the image background is measured. To obtain the SNR value of the image, divide the signal intensity value of the white matter by the standard deviation value of the background.
Practical applications of low transmitter bandwidth (Low SAR mode)
Low transmitter bandwidth mode is the most appropriate option to choose when scanning neonates and sedated patients due to their inability to provide feedback to the operator. The low SAR mode must be chosen while scanning pregnant patients to avoid any potential RF harm to the fetus. Additionally, low transmitter bandwidth RF pulses are also useful for scanning patients with MRI conditional implants, such as MRI conditional pacemakers and heart valves
MRI Field Strength and SNR
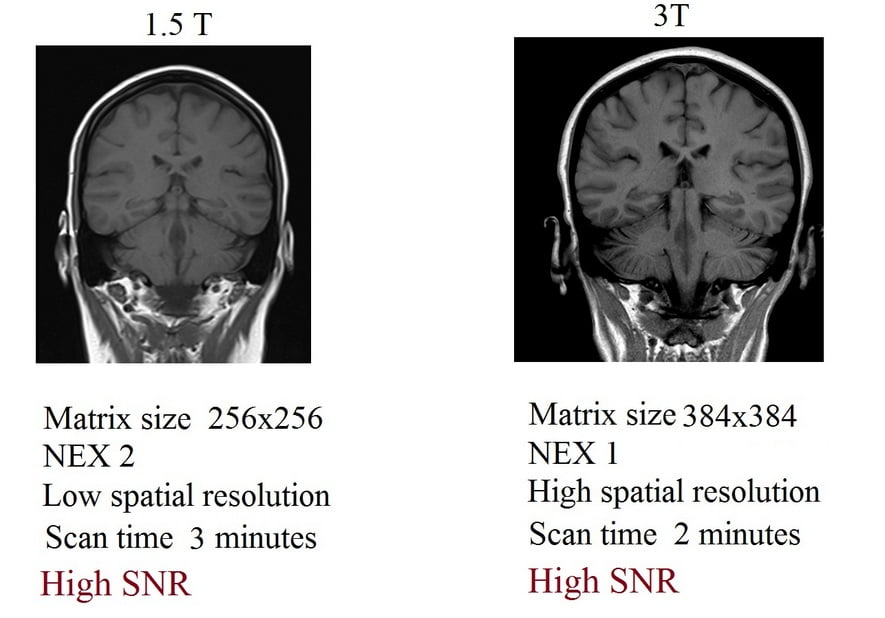
Field strength and SNR (Signal-to-Noise Ratio) are directly proportional to each other. Increasing the field strength will raise the longitudinal magnetisation by aligning more protons with the axis of the main magnetic field. This alignment leads to an overall increase in the signal produced, subsequently enhancing the SNR. MRI systems that utilize higher field strengths yield images with higher SNR compared to low field strength systems.
In addition to improved SNR images, high field strength MRI systems can also generate high spatial resolution images in less time. This advantage is particularly valuable for high-resolution imaging or when conducting rapid scans on claustrophobic or moving patients. For instance, consider a T2 TSE sequence with a matrix size of 320×320 and a number of excitations (NEX) set to 2, resulting in 100% SNR. Such a sequence would take approximately 5 minutes in a 1.5T scanner. In contrast, a similar level of SNR can be attained in a 3T system with NEX set to 1, completing the process in around 2.5 minutes.
Radiofrequency coil and SNR
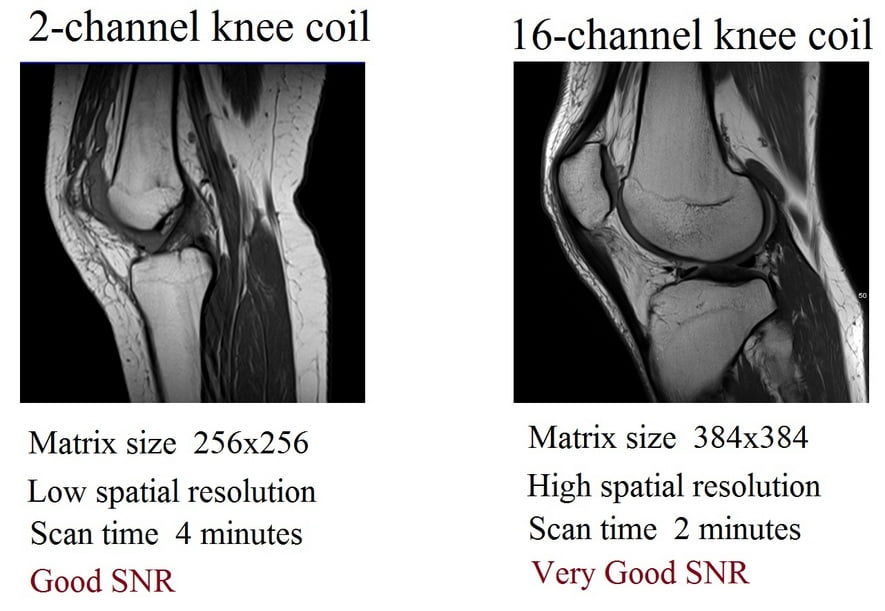
There is a wide range of RF transmitter and receiver coils available in most MRI systems. The correct selection of the appropriate radiofrequency coil is essential for achieving the optimum SNR. To achieve the maximum SNR, the RF coils should be as close as possible to the anatomy being imaged. This is the main reason that most MRI systems have dedicated coils for each body part. SNR also depends on the number of transmitter and receiver elements within the RF coils. The higher the number of transmitter and receiver elements, the better the SNR; for example, a 32-channel (receiver element) body coil will produce better SNR compared to a 4-channel body coil.
MRI operators will most often notice a significant drop in SNR when scanning patients with a high BMI. The reason is that the center of the anatomy is too far from the receiver coils. The user must manipulate the scanning parameters to improve SNR while scanning patients with a high BMI.
Tissue Characteristics and SNR
SNR also depends on the magnetic characteristics of the tissue being imaged. Tissues with a higher number of protons will produce better signal intensities and a higher SNR. For example, if a scan were performed using the same protocol on an infant and an adult, the infant’s scan would exhibit a higher SNR.
MRI operators may have noticed that adding fat saturation to sequences often results in a grainy, low-SNR image. In this case, nullifying the signals from the fat protons reduces the overall signal intensity from the imaged anatomy. Any reduction in signal intensity subsequently decreases the overall SNR.
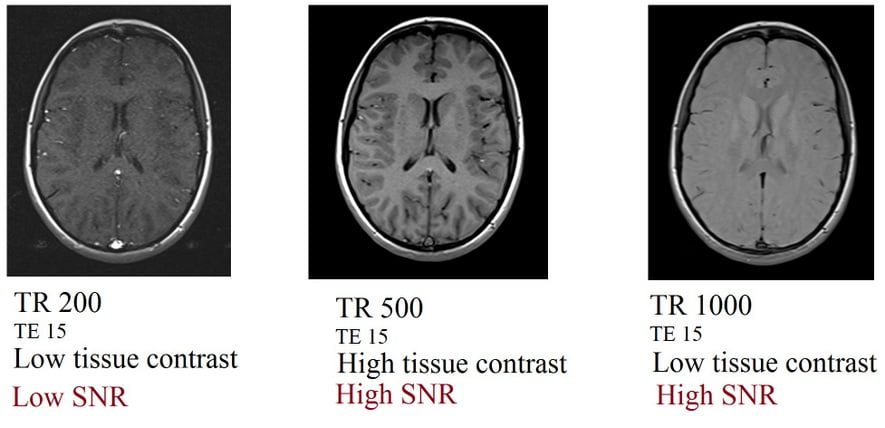
TR and SNR
Increasing the TR will enhance the SNR, as a higher TR allows the longitudinal magnetization to approach its maximum and generate high signal intensities. However, extending the TR beyond a certain limit will reduce the T1 effect. For instance, in a T1 sequence with a TR of 500 and an SNR of 100%, raising the TR to 1000 will amplify the SNR while diminishing the T1 effect, resulting in images with notably poor tissue contrast. The judicious selection of TR holds significant importance in T1-weighted imaging, as it influences both SNR and tissue contrast quality.
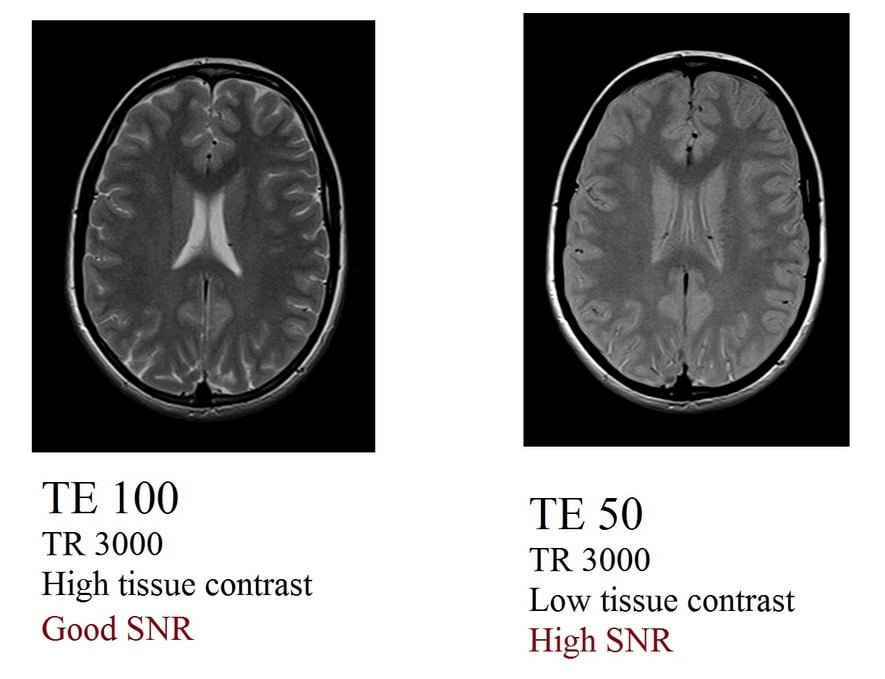
TE and SNR
Increasing the TE will reduce the SNR. A long TE will cause the transverse magnetization to decay to very low values and result in signal loss. Decreasing the TE beyond a certain limit will reduce the T2 effect. For example, in a T2 sequence with an TR of 5000 ms, TE of 110 ms, and SNR of 100%, decreasing the TE to 50 ms will increase the SNR but reduce the T2 effect, potentially producing images with very poor tissue contrast. Reducing the TE to increase the SNR should be reserved for T1-weighted sequences.
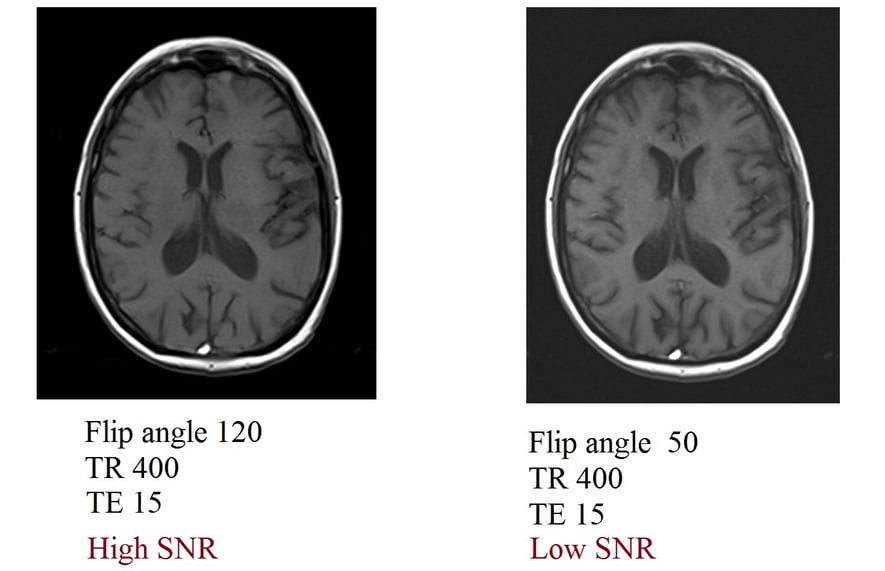
Flip Angle and SNR
High transmitter bandwidth can be used effectively to reduce scan times in claustrophobic and moving patients. This option will significantly reduce the minimum TR and TE values, allowing the user to manually decrease the TR and TE values and thereby reduce scan time. The main disadvantage of this method is that shortening the TEs and TRs usually results in more noise and increases the potential for peripheral stimulation. The diagrams below show how to choose these options and display the results of the manipulations
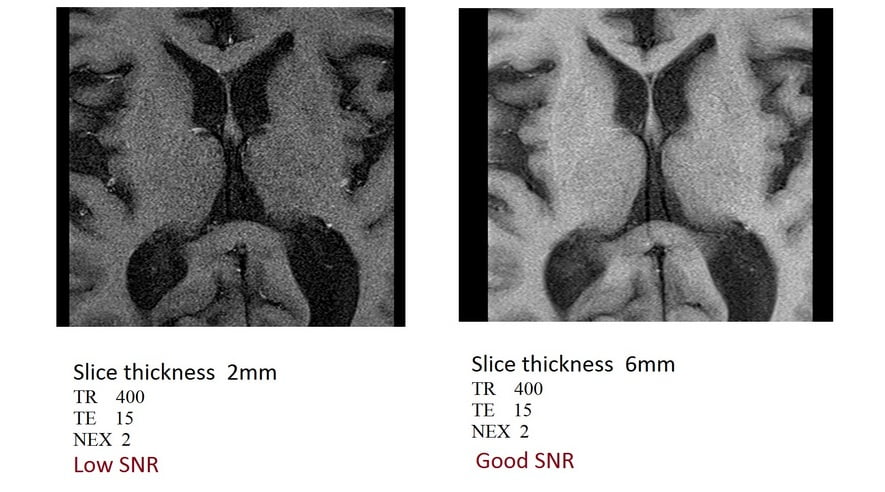
Slice Thickness and SNR
Increasing the slice thickness will increase the SNR. This follows the principle that a greater slice thickness leads to a larger voxel size, resulting in more signal being received by the individual voxels. However, increasing the slice thickness will also reduce the spatial resolution and increase the partial volume effects. For instance, consider a T1 sequence with a slice thickness of 2 mm and a relative SNR of 40%. If the slice thickness is increased to 6 mm, the SNR will rise to 90%.
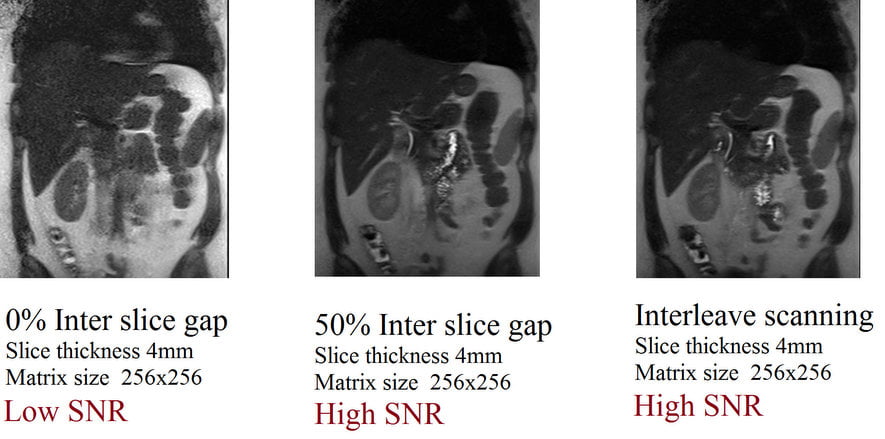
Slice Gap and SNR
The slice gap is the distance between two adjacent slices. It is usually calculated as a percentage of the slice thickness. Slice gaps are necessary in order to avoid slice overlapping due to imperfections in the RF pulse. Even when choosing a rectangular slice profile, perfect rectangular signals are not produced. By removing the slice gap, the two adjacent slices will overlap at their edges. This results in the RF pulse of one slice exciting a small portion of the adjacent slice, a phenomenon known as cross-talk. The cross-talk effect creates a saturation effect in the area of slice overlap, leading to a significant reduction in SNR (Signal-to-Noise Ratio).
If a T2 single-shot FSE (HASTE) sequence with a 4mm slice thickness and a 50% (2mm) slice gap has its slice gap reduced to 0%, it will result in slice overlap and produce images with low SNR. This is one of the main reasons why HASTE sequences with continuous slice acquisitions exhibit high SNR in the first image followed by low SNR in subsequent images. To mitigate this, the slice gap can be increased or the interleave option can be chosen (which scans odd-numbered slices together and then even-numbered slices together). It should be noted that increasing the slice gap beyond certain limits, usually above 50%, can cause misregistration.
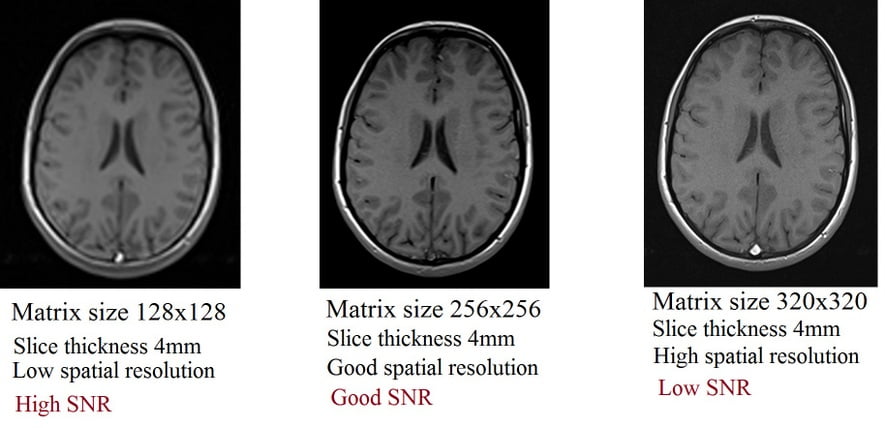
Matrix size and SNR
Increasing the matrix size will reduce the SNR. Increasing the matrix size reduces the voxel size, which in turn reduces the amount of signal received by the individual pixels. Smaller pixels will receive less signal, leading to the production of low SNR images. For instance, consider a T1 TSE sequence with a 100 FOV, 4mm slice thickness, 256×256 matrix size, and a relative SNR of 100%. If the matrix size is increased from 256×256 to 320×320, the SNR will decrease to 74%. On the other hand, decreasing the matrix size will lower the spatial resolution and result in blurry images. The correct selection of the matrix size for a particular FOV is necessary to produce optimum quality images.
Field of view (FOV) and SNR
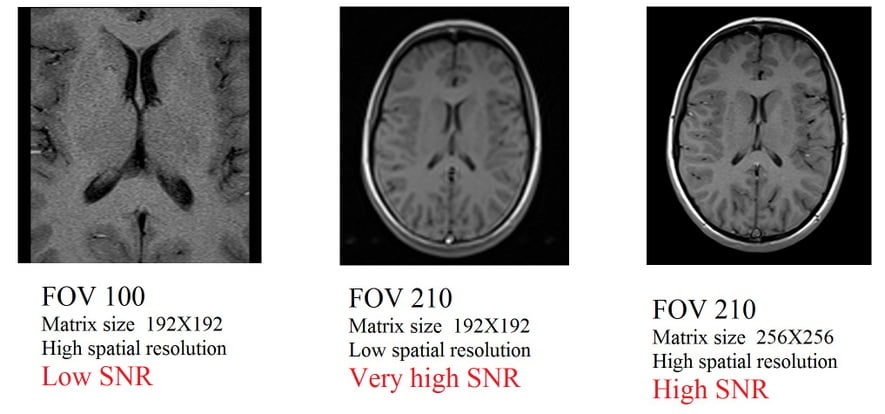
Increasing the field of view (FOV) will lead to an increase in the signal-to-noise ratio (SNR). This is because enlarging the FOV results in larger pixel sizes, which in turn amplifies the amount of signal captured by individual pixels. Larger pixels can gather more signal, consequently generating images with a higher SNR. However, it’s important to note that enhancing the FOV will concurrently diminish the spatial resolution of the images, causing them to appear blurred.
To achieve optimal spatial resolution, users should augment the matrix size whenever they increase the FOV. For instance, if a T1 turbo spin-echo (TSE) sequence with a 100mm FOV and a 192×192 matrix, exhibiting a relative SNR of 100%, experiences an FOV expansion from 100mm to 210mm, the SNR will subsequently rise to 170%. Although this adjustment results in heightened SNR, it also yields images with lower spatial resolution.
To counteract this decline in spatial resolution, one effective approach is to further increase the matrix size to 256×256. This enhancement in the matrix size will not only improve spatial resolution but also maintain a satisfactory SNR level of 120%
Receiver bandwidth and SNR
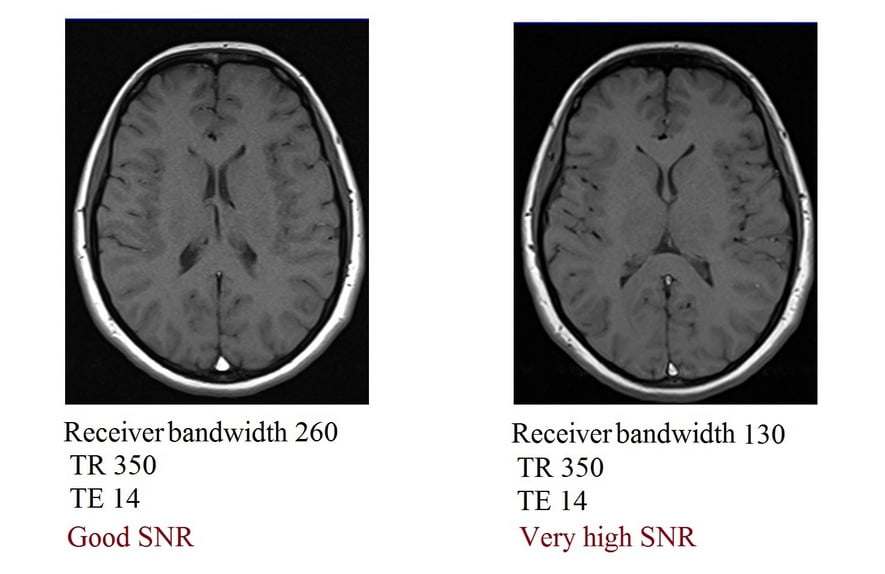
Increasing the receiver bandwidth reduces the SNR. Receiver bandwidth refers to the range of frequencies or wavelengths collected during the reception phase (frequency encoding) of RF pulses. Increasing the bandwidth reduces the scan time, susceptibility artifacts, and chemical shift artifacts. Decreasing the bandwidth to half will increase the SNR by 30%. In this example, a T1 sequence with a bandwidth of 260, an acquisition time of 2 minutes, and a relative SNR of 100%, experiences a decrease in bandwidth from 260 to 130. This raises the relative SNR to 130% but extends the scan time to 3 minutes. Caution should be exercised, as reducing the bandwidth beyond certain limits will lead to an increase in susceptibility and chemical shift artifacts.
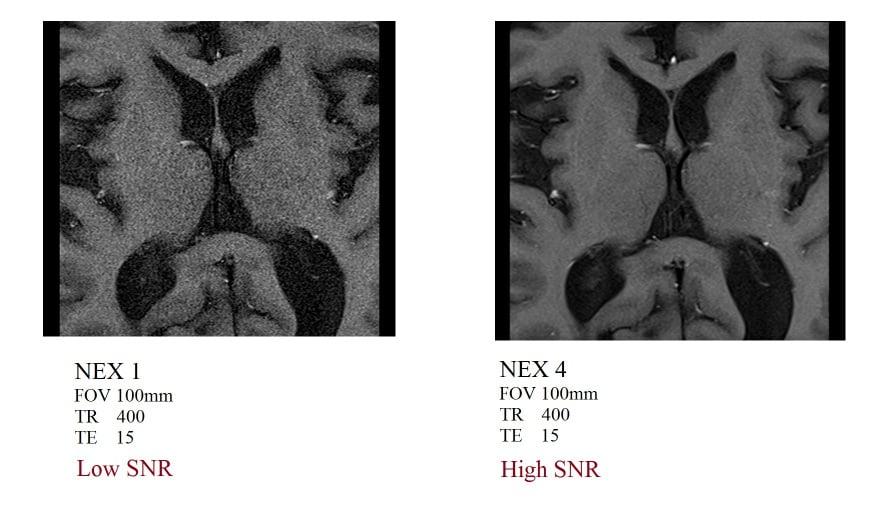
Number of excitations (NEX) and SNR
The number of excitations (averages) is a measurement parameter used to represent how many times data is acquired repeatedly to form the same image. Increasing the number of excitations (averages) will enhance the signal-to-noise ratio (SNR) by the square root of two (√2). Doubling the NEX will result in a 140% increase in SNR but will also double the scan time. For instance, consider a T1 TSE sequence with a scan time of 2 minutes, NEX set at 1, and an SNR of 40%. If the NEX is increased from 1 to 4, the SNR will rise to 100%, but the scan time will extend to 8 minutes.
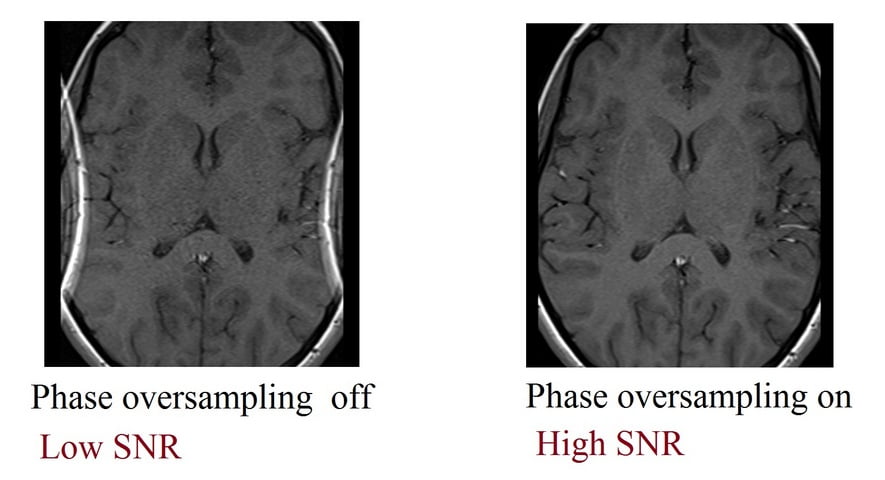
Phase oversampling and SNR
Phase oversampling is a technique used to eliminate the phase wrap or wrap-around artifact. Phase oversampling is performed by increasing the sampling frequency in the phase encoding direction. Increasing the phase oversampling will expand the field of view (FOV) and the number of phase-encoding steps in the phase direction. Furthermore, increasing the phase oversampling will also enhance the signal-to-noise ratio (SNR) but will lead to a longer acquisition time. If a T1 TSE sequence with a 150 FOV and a relative SNR of 100% has its phase oversampling changed to 100%, the SNR will increase to 120%.
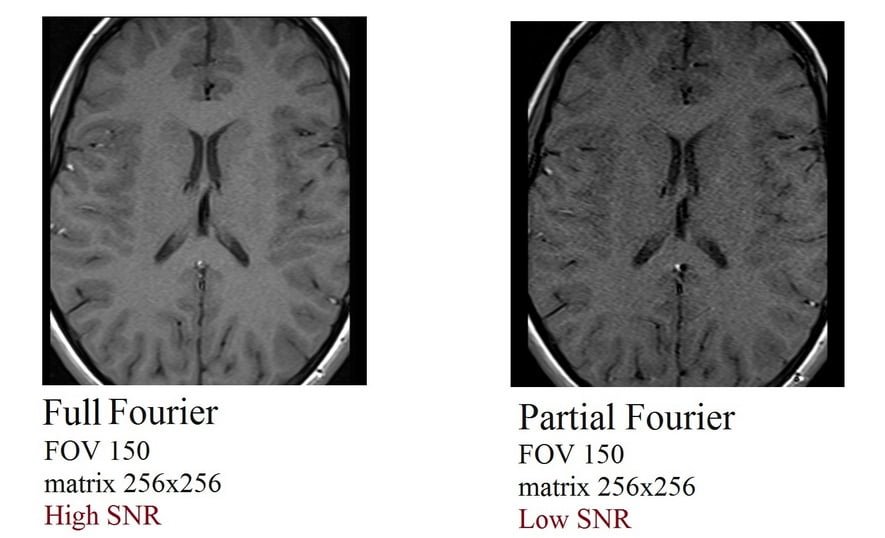
Partial K-space filling and SNR
Partial k-space filling techniques save a significant amount of scan time without requiring changes to other scanning parameters. The two main types of partial k-space acquisition techniques are partial Fourier imaging and partial echo imaging. Both of these techniques are used for fast imaging to produce images of similar resolution, albeit with compromised SNR (Signal-to-Noise Ratio).
In partial Fourier imaging, only half or slightly more than half of the k-space lines in the phase encoding direction are acquired to create the entire image. While this reduces scan time, it results in images with low SNR.
In partial echo imaging, only a portion of the echoes in the frequency encoding direction are sampled to create the complete image. This approach also decreases scan time, but it yields images with reduced SNR.
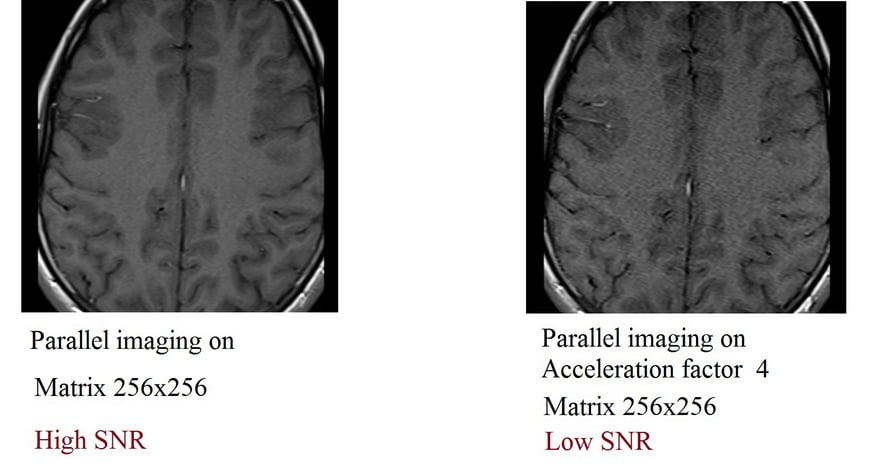
Parallel imaging techniques and SNR
Using parallel imaging techniques will degrade the SNR of the reconstructed images. The noise produced in the reconstructed images is due to decreased data sampling and noise amplification caused by the parallel reconstruction algorithm. Increasing the acceleration factor in parallel imaging will reduce the SNR. As a final example, if a T1 TSE sequence with a parallel imaging acceleration factor of 2 is increased to an acceleration factor of 4, the original SNR will be reduced by 40%.