T2* (T2 star) MRI : Physics and Applications
T2* (T2 star) MRI is a specialized magnetic resonance imaging (MRI) technique that capitalizes on the T2* relaxation time. This relaxation time measures how quickly the magnetization of protons decays due to magnetic field inhomogeneities and magnetic susceptibility differences within tissues. This characteristic makes T2* MRI particularly valuable for detecting early iron deposition in organs such as the liver and for detecting microhemorrhages
Physics of T2* (T2 star)
T2* (read as T2 star) relaxation time is a measure of transverse relaxation that encompasses both the intrinsic T2 effects and additional dephasing resulting from inhomogeneities in the magnetic field. These inhomogeneities may be intrinsic, arising from the tissue’s characteristics, or extrinsic, stemming from imperfections in the MRI machine’s magnetic field. In a theoretical scenario devoid of these inhomogeneities, T2 and T2* would be identical. However, due to the real-world presence of factors such as magnetic field imperfections, varying tissue types, and susceptibility differences, T2* relaxation is invariably faster than T2 relaxation.
Mathematically, this relationship can be represented as: 1/T2* = 1/T2 + γΔB where γ is the gyromagnetic ratio and ΔB denotes the magnetic field inhomogeneities
T2* effects are most commonly observed in gradient echo (GRE) imaging, where the MRI signal fades away more rapidly than with T2 decay alone. As a result, most T2* weighted sequences are GRE sequences.
T2* (T2 star) Weighted Sequence Applications
- Functional MRI (fMRI): fMRI uses T2* MRI to detect brain activity by measuring changes in cerebral blood flow. Active brain regions show shifts in oxyhemoglobin to deoxyhemoglobin balance, influencing T2* values, allowing for mapping of these active regions.
- Assessment of Iron Overload: T2* MRI helps identify iron accumulation in organs, particularly the liver and heart, by noting decreases in T2* times. This method aids in evaluating conditions like hemochromatosis or thalassemia.
- Arterial Spin Labeling (ASL): ASL, although not exclusively a T2* technique, employs T2* sensitivity to blood magnetization changes to determine tissue perfusion, especially in the brain.
- Susceptibility-Weighted Imaging (SWI): SWI leverages T2* discrepancies from susceptibility variations. It’s notably sensitive to venous blood and microhemorrhages, useful for identifying vascular issues, traumas, or microbleeds in diseases like cerebral amyloid angiopathy.
- Cartilage Imaging: T2* mapping offers insights into cartilage health and composition. Changes in T2* values in cartilage might signify early degenerative signs even before visible morphological changes.
T2* (T2 star) Weighted Image of the Brain

T2*(HEMO) image of brain

T2*(SWI) image of brain
Pathological Appearances on T2* (T2 star) Weighted Images
- Hemorrhage: Blood products, particularly deoxyhemoglobin and hemosiderin, create magnetic field inhomogeneities, leading to signal drop or “blooming” on T2* weighted images. This is especially useful for detecting microhemorrhages.
- Calcifications: Calcifications are another common source of magnetic susceptibility differences. Like hemorrhage, they cause a signal drop on T2* weighted images.
- Venous Structures: The deoxygenated blood in veins is paramagnetic and can cause a loss of signal on T2* weighted images, making them more conspicuous. This is exploited in Susceptibility Weighted Imaging (SWI), a variant of T2* imaging.
- Iron Deposition: Certain conditions, like hemochromatosis or multiple blood transfusions, lead to excessive iron storage in tissues. Iron is paramagnetic and can cause pronounced signal loss on T2* weighted images, especially in organs like the liver or brain.
- Tumors: Some tumors can cause local field inhomogeneities either because of hemorrhage, calcifications, or other tissue changes, and may have a distinct appearance on T2* weighted images.
- Air-tissue and Bone-tissue Interfaces: At these boundaries, there’s a significant difference in magnetic susceptibility, which can lead to signal voids or artifacts on T2* weighted images.
T2* (SWI) Image of the Brain Hemorrhage
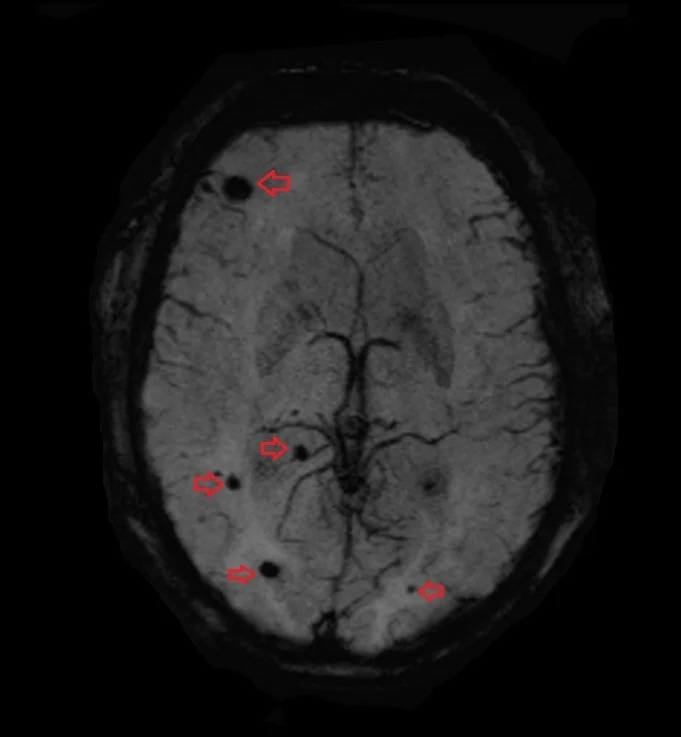
T2*(SWI) image of brain
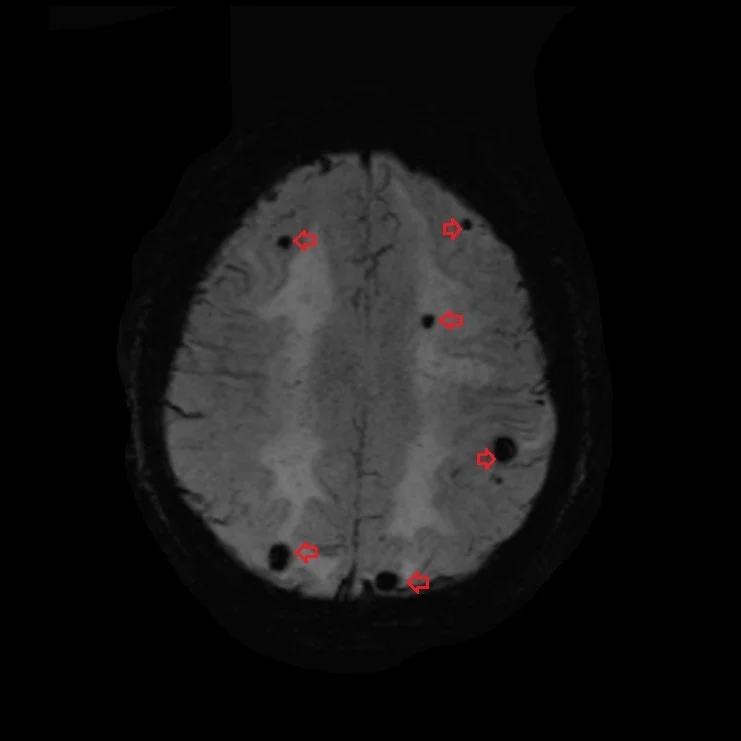
T2*(SWI) image of brain
T2* (T2 star) Image of the Brain Hemorrhage

T2*(HEMO) image of brain

T2*(HEMO) image of brain
References
- Haacke, E. M., Xu, Y., Cheng, Y. C. N., & Reichenbach, J. R. (2004). Susceptibility weighted imaging (SWI). Magnetic Resonance in Medicine, 52(3), 612-618.
- Reichenbach, J. R., & Haacke, E. M. (2001). High-resolution BOLD venographic imaging: a window into brain function. NMR in Biomedicine: An International Journal Devoted to the Development and Application of Magnetic Resonance In Vivo, 14(7-8), 453-467.
- Rauscher, A., Sedlacik, J., Barth, M., Mentzel, H. J., & Reichenbach, J. R. (2005). Magnetic susceptibility-weighted MR phase imaging of the human brain. American Journal of Neuroradiology, 26(4), 736-742.
- Anderson, L. J., et al. (2001). “Measurement of liver iron by magnetic resonance imaging in the UK Thalassemia population.” Journal of Cardiovascular Magnetic Resonance.