T1 vs T2 MRI
Magnetic Resonance Imaging (MRI) utilizes two primary sequences: T1-weighted (T1) and T2-weighted (T2). T1 MRI highlights anatomy, provides crisp images, and shows fluids as dark. Conversely, T2 MRI focuses on pathology, making fluids bright, which is ideal for visualizing inflammation, edema, and certain lesions. The distinction between T1 and T2 is crucial for accurate medical diagnosis. In essence, while T1 outlines structures, T2 detects abnormalities. The choice between T1 and T2 depends on the clinical query and the body part being examined. Understanding these fundamental MRI sequences is vital for radiographers, radiologists, and clinicians to ensure the right imaging method is chosen for accurate diagnosis.
T1-Weighted Imaging (T1 MRI)
T1-weighted imaging emphasizes the differences in the longitudinal relaxation times (T1) of tissues. The contrast on T1WI is determined by the rate at which excited protons return to their equilibrium state, which is influenced by the tissue environment. Specifically, the contrast is produced by adjusting the repetition time (TR) and echo time (TE). For T1-weighted images, a short TR(400-600ms) and short TE(10-20ms) are utilized.
In T1WI, the image typically shows fat as bright (or hyperintense) and water or fluid-filled areas as dark (or hypointense). Therefore, anatomical structures with a high fat content, such as adipose tissue, will appear brighter on T1-weighted images, while fluid-filled structures, like the ventricles of the brain and spinal canal containing cerebrospinal fluid (CSF), will appear dark. Other fluid-filled areas, such as joints with synovial fluid, the bladder in the pelvis, the gallbladder, common bile duct, and ureters in the abdomen, will also appear dark in T1-weighted images.
T2-Weighted Imaging (T2 MRI)
T2-weighted imaging emphasizes the differences in the transverse relaxation times (T2) of tissues. The contrast on T2WI is determined by the rate at which excited protons lose phase coherence due to interactions with their surroundings. The image contrast in T2WI is produced by adjusting the TR and TE. For T2-weighted images, a long TR(3000-6000ms) and long TE(90-110ms) are used.
In T2WI, fluids appear bright (or hyperintense). Therefore, areas filled with CSF, such as the brain’s ventricles or the spinal canal, are prominent. Other fluid-filled areas, such as joints with synovial fluid, the bladder in the pelvis, the gallbladder, common bile duct, and ureters in the abdomen, will also appear bright in T2-weighted images.
T1 and T2 MRI Image Appearance of Various Structures in the Brain
T2 appearance of the brain
- Muscle: Intermediate to dark
- Fat: Very bright
- CSF: Intermediate to bright
- White Matter: Darker than gray matter
- Gray Matter: Intermediate to bright
- Bone: Dark (low signal)
- Bone Marrow: Variable but often bright
- Blood Vessels: Mostly Dark, Depending on flow characteristics, can be bright or dark
- Pituitary Gland: Intermediate Choroid Plexus: Intermediate to bright
- Cerebellum (consists of both white and gray matter): Gray matter brighter than white matter
- Brain Stem: Intermediate
- Sinuses: Dark (filled with air)
- Thalamus: Brighter than white matter
- Putamen: Brighter than white matter
- Pineal Gland: Intermediate
- Hippocampus: Brighter than white matter
- Corpus Callosum: Intermediate to Dark
- Caudate Nucleus: Brighter than white matter
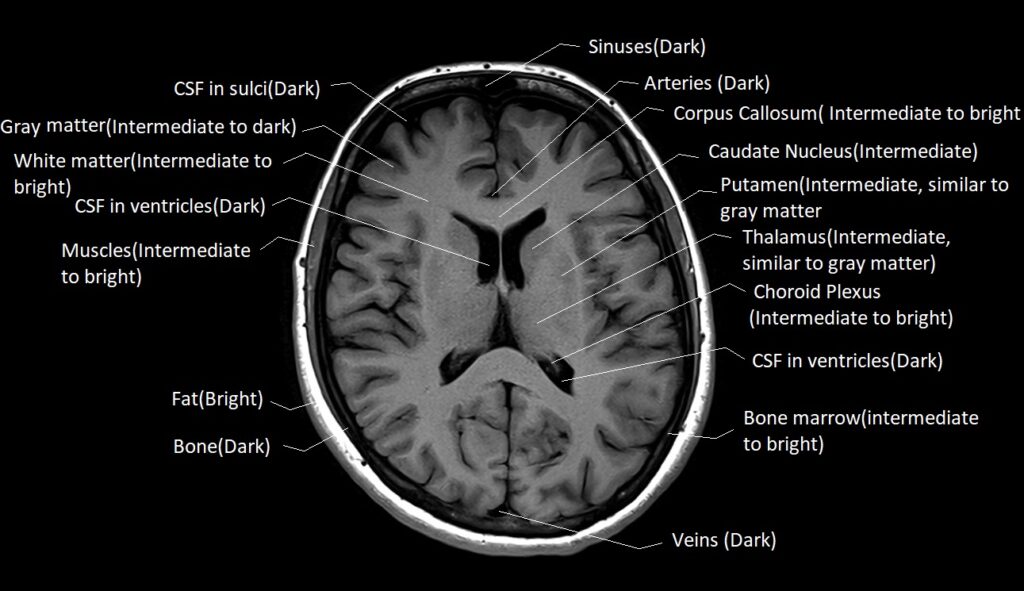
T1 appearance of the brain
- Muscle: Intermediate
- Fat: Bright
- CSF : Dark
- White Matter: Intermediate to bright
- Gray Matter: Slightly darker than white matter
- Bone: Dark
- Bone Marrow: Bright (due to fatty content in adults)
- Blood Vessels: Mostly Dark, Depending on flow characteristics, can be bright or dark
- Pituitary Gland: Intermediate.
- Choroid Plexus: Intermediate to bright
- Cerebellum (consists of both white and gray matter): Gray matter darker than white matter
- Brain Stem: Intermediate
- Sinuses: Dark (filled with air)
- Thalamus: Intermediate, similar to gray matter
- Putamen: Intermediate, similar to gray matter
- Pineal Gland: Intermediate
- Hippocampus: Intermediate, similar to gray matter
- Corpus Callosum: Intermediate to bright
- Caudate Nucleus: Intermediate, similar to gray matter
T1 MRI Image of the Brain
T2 MRI Image of the Brain

T1 and T2 MRI Image Appearance of Various Structures in the Spine
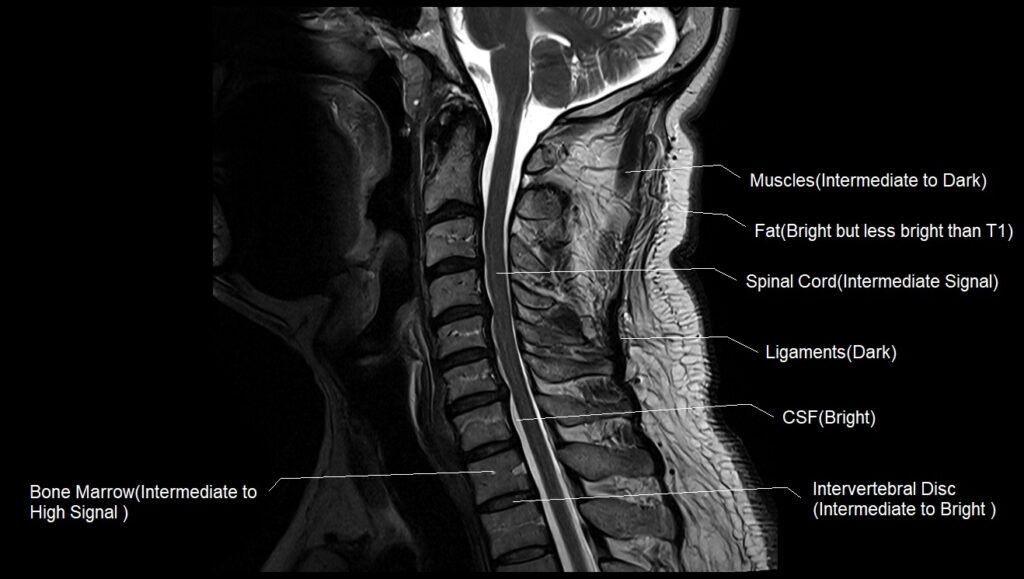
T2 appearance of the Cervicle spine
- Muscle: Intermediate to dark
- CSF : Bright.
- Bone: Dark (low signal).
- Bone Marrow: Intermediate to bright.
- Blood Vessels: Mostly Dark, Depending on flow characteristics, can be bright or dark.
- Spinal Cord: Intermediate signal
- Fat: Bright but darker than T1.
- Intervertebral Disc: Nucleus pulposus and annulus intermediate.
- Ligaments: Intermediate to dark.
- Nerve Roots: Intermediate signal
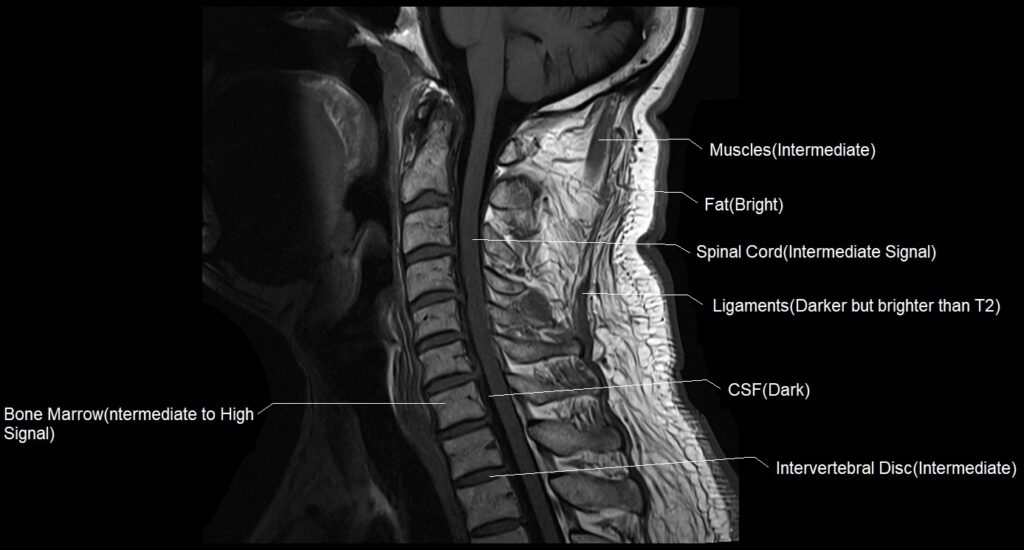
T1 appearance of the Cervicle spine
- Muscle: Intermediate
- CSF : Dark
- Bone: Dark
- Bone Marrow: Bright
- Blood Vessels: Mostly Dark, Depending on flow characteristics, can be bright or dark
- Spinal Cord: Intermediate signal
- Fat: Bright
- Intervertebral Disc: Nucleus pulposus brighter, annulus intermediate
- Ligaments: Intermediate
- Nerve Roots: Intermediate signal
T1 MRI Image of the Cervical Spine
T2 MRI Image of the Cervical Spine
T1 MRI Image of the lumbar spine

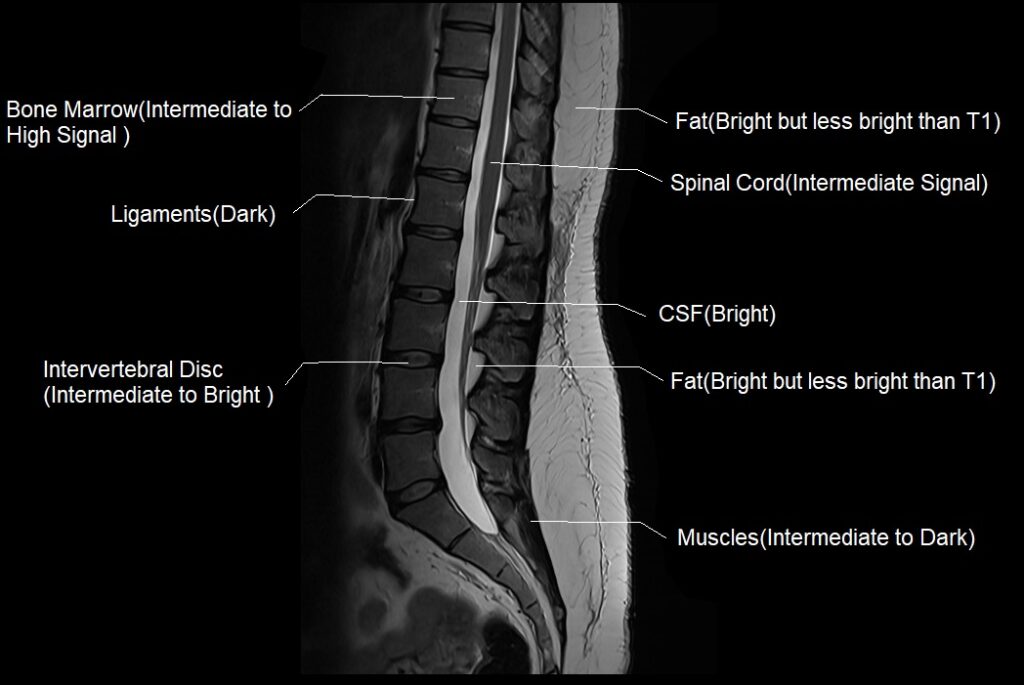
T2 MRI Image of the the lumbar spine
T1 Axial MRI Image of the Cervical Spine
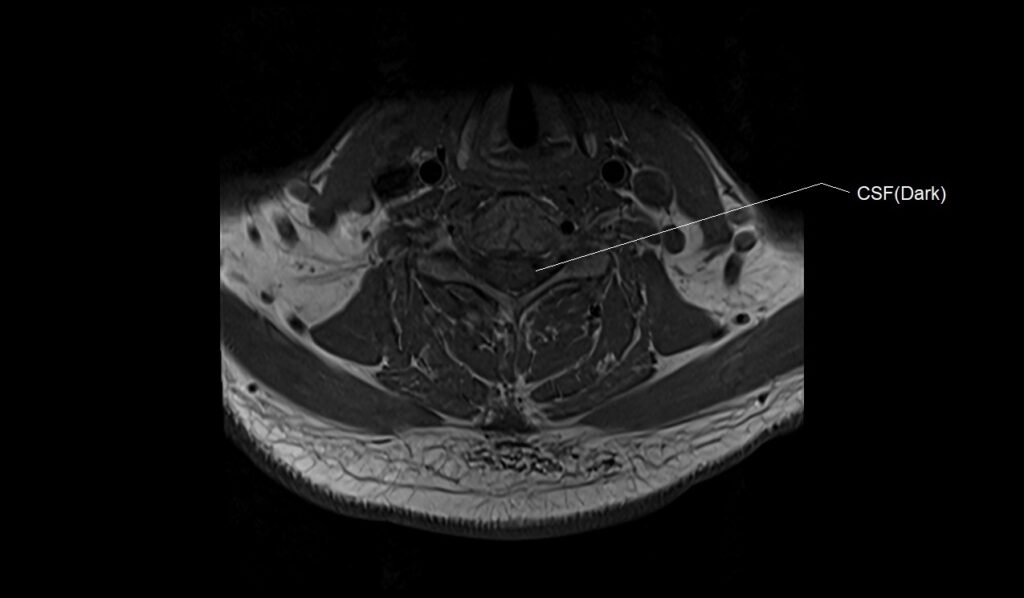
T2 Axial MRI Image of the Cervical Spine
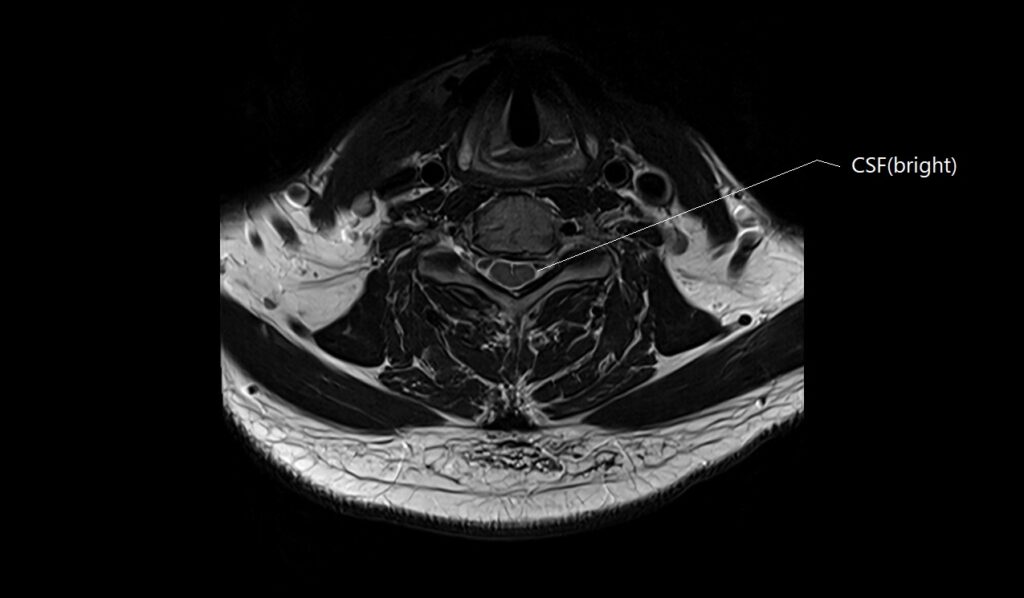
T2 Axial MRI Image of the Cervical Spine
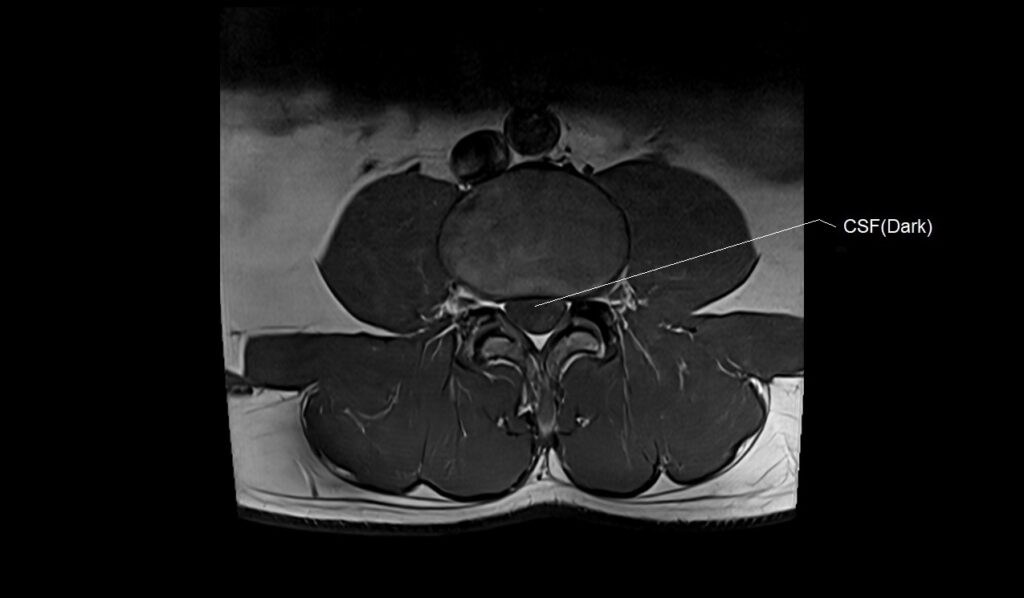
T2 Axial MRI Image of the Cervical Spine
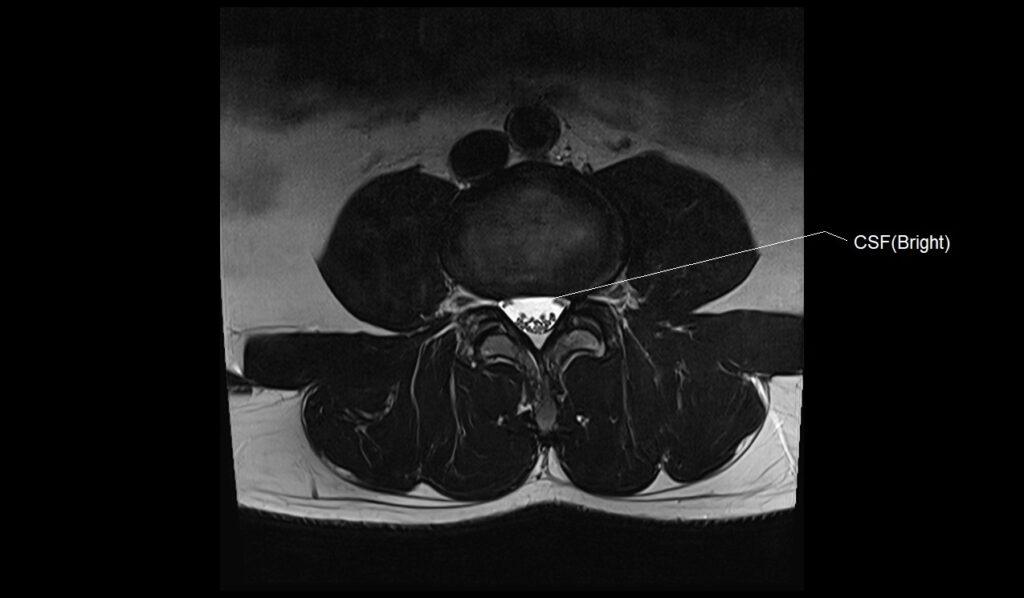
T1 and T2 MRI Image Appearance of Various Structures in the Head and Neck
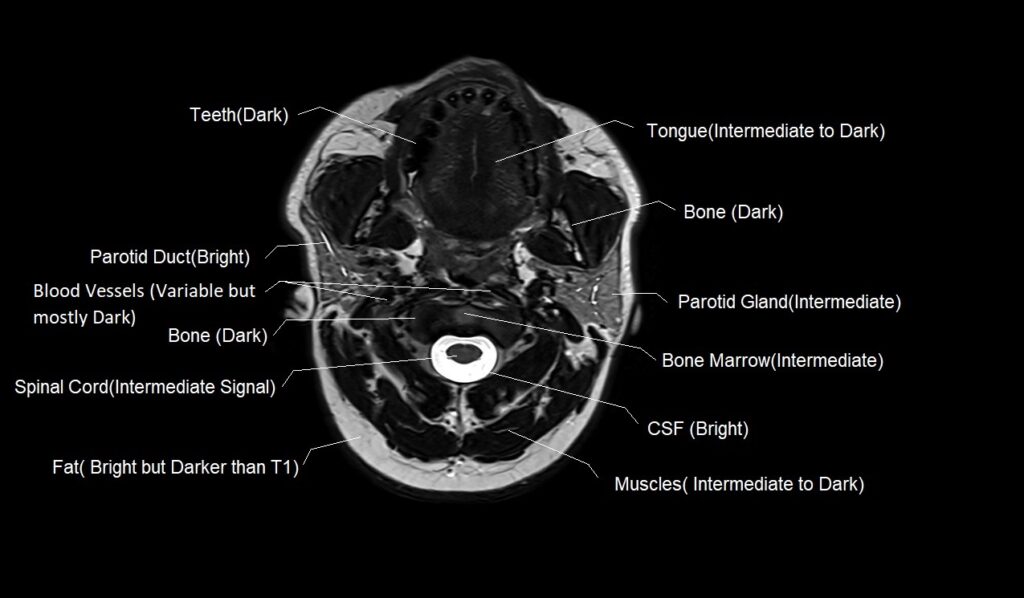
T2 appearance of the Neck
- Muscle: Intermediate to dark
- CSF : Bright
- Bone: Dark (low signal)
- Bone Marrow: Intermediate to bright
- Blood Vessels: Mostly Dark, Depending on flow characteristics, can be bright or dark
- Spinal Cord: Intermediate signal
- Fat: Bright but darker than T1
- Ligaments: Intermediate to dark.
- Nerve Roots: Intermediate signal
- Teeth: Dark
- Tongue: Intermediate to Dark
- Parotid Gland: Intermediate to bright
- Parotid Duct:Bright
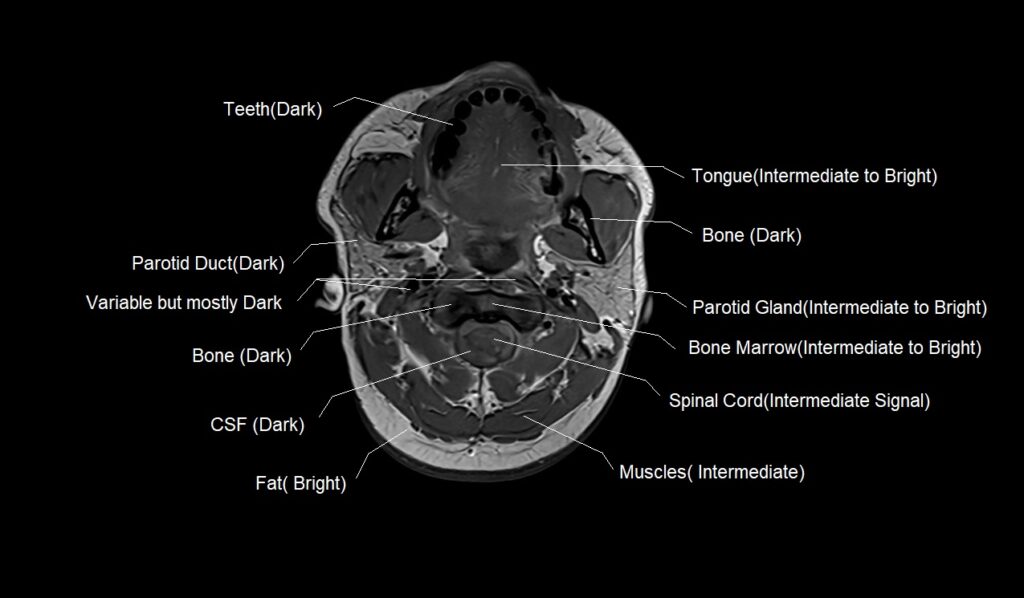
T1 appearance of the Neck
- Muscle: Intermediate.
- CSF : Dark.
- Bone: Dark
- Bone Marrow: Bright .
- Blood Vessels: Mostly Dark, Depending on flow characteristics, can be bright or dark.
- Spinal Cord: Intermediate signal
- Fat: Bright
- Ligaments: Intermediate
- Nerve Roots: Intermediate signal
- Teeth: Dark
- Tongue: Intermediate to bright
- Parotid Gland: Intermediate to bright
- Parotid Duct:Dark
T1 MRI Image of the Neck
T2 MRI Image of the Neck
T1 and T2 MRI Image Appearance of Various Structures in the Abdomen
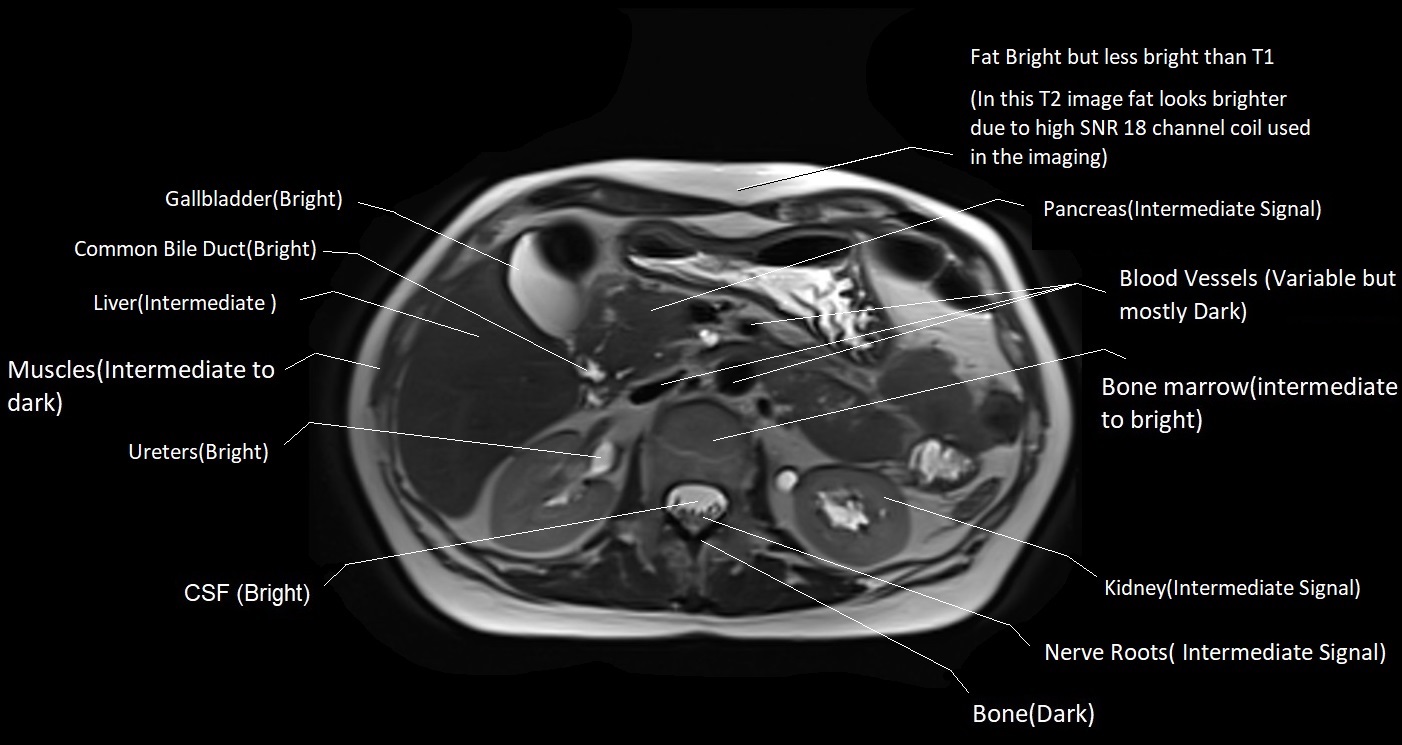
T2 appearance of the Abdomen
- Muscle: Intermediate to dark
- CSF : Bright
- Bone: Dark (low signal)
- Bone Marrow: Intermediate to bright
- Blood Vessels: Mostly Dark, Depending on flow characteristics, can be bright or dark
- Spinal Cord: Intermediate signal
- Fat: Bright but darker than T1
- Ligaments: Intermediate to dark.
- Nerve Roots: Intermediate signal
- Liver: Intermediate Signal
- Gallbladder: Bright(when filled with bile)
- Common Bile Duct: Bright (when filled with bile)
- Spleen: Intermediate Signal
- Kidney:Intermediate Signal
- Ureters:Bright
Pancreas:Intermediate Signal
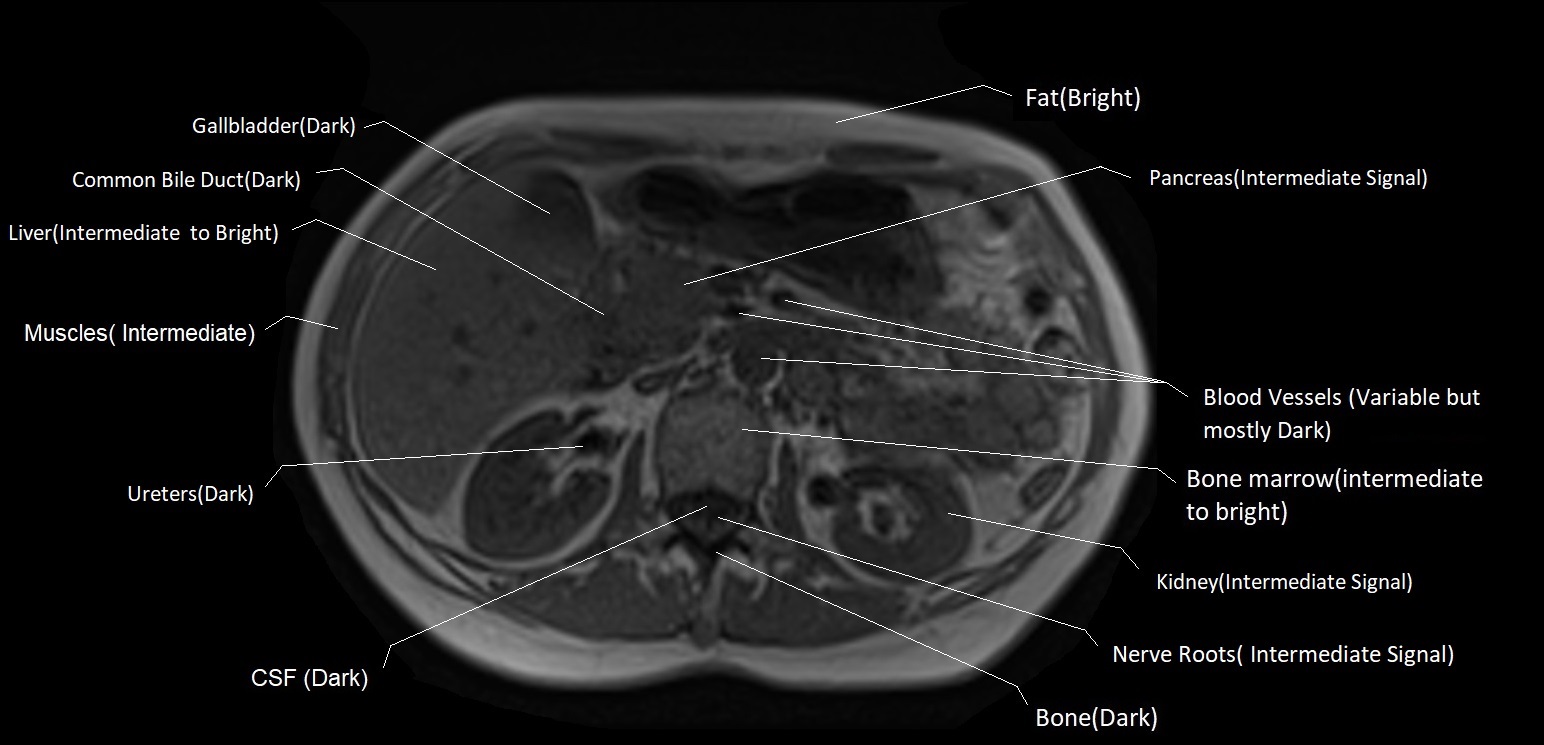
T1 appearance of the Abdomen
- Muscle: Intermediate.
- CSF : Dark.
- Bone: Dark
- Bone Marrow: Bright .
- Blood Vessels: Mostly Dark, Depending on flow characteristics, can be bright or dark.
- Spinal Cord: Intermediate signal
- Fat: Bright
- Ligaments: Intermediate
- Nerve Roots: Intermediate signal
- Liver: Intermediate Signal
- Gallbladder: Dark(when filled with bile)
- Common Bile Duct:Dark (when filled with bile)
- Spleen: Intermediate Signal
- Kidney:Intermediate Signal
- Ureters:Dark
Pancreas:Intermediate Signal
T1 MRI Image of the Abdomen
T2 MRI Image of the Abdomen
T1 MRI Image of the Abdomen

T1 and T2 MRI Image Appearance of Various Structures in the Pelvis
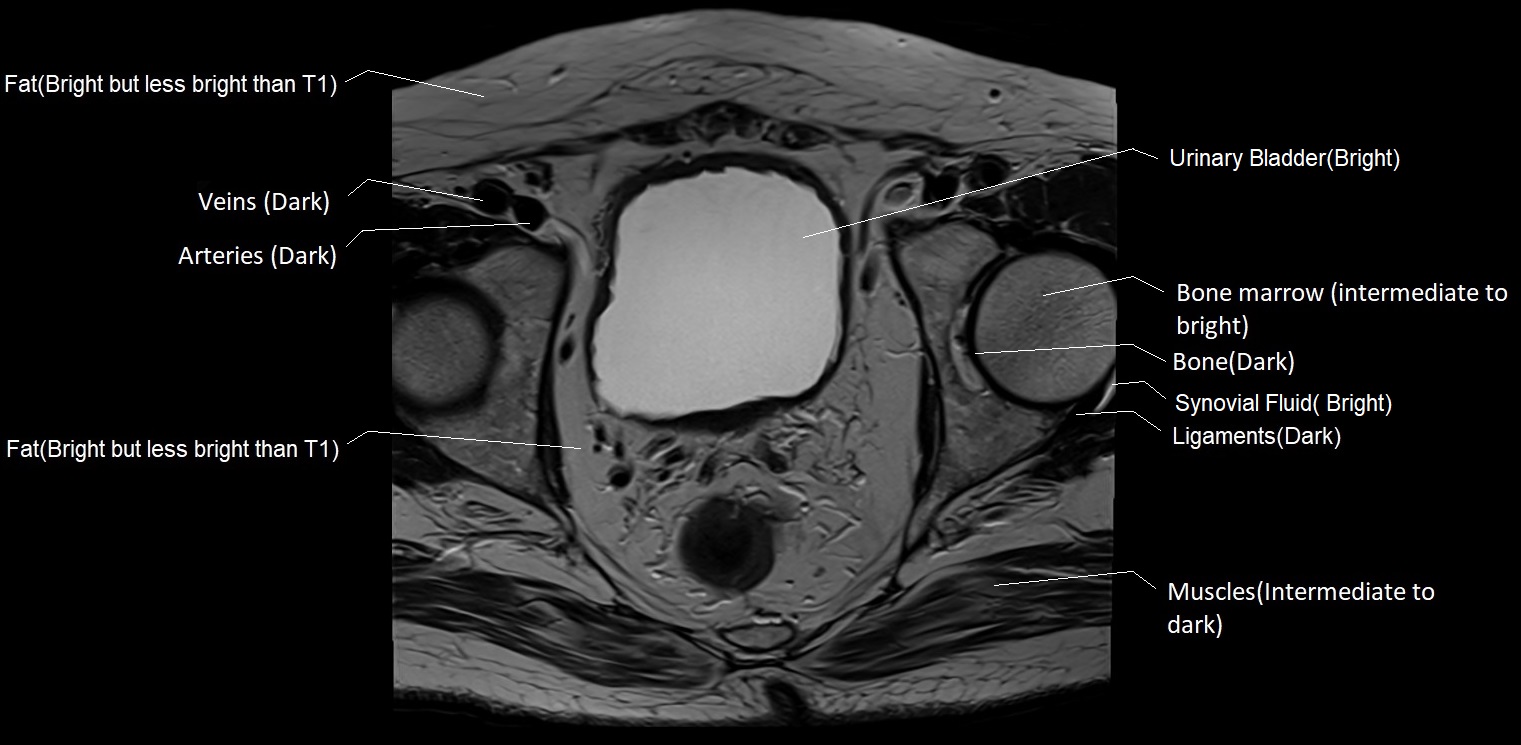
T2 appearance of the Pelvis
- Muscle: Intermediate to dark
- Bone: Dark (low signal)
- Bone Marrow: Intermediate to bright
- Blood Vessels: Mostly Dark, Depending on flow characteristics, can be bright or dark
- Fat: Bright but darker than T1
- Ligaments: Intermediate to dark.
- Nerve Roots: Intermediate signal
- Urinary Bladder: Bright (when filled with urine)
- Prostate:Intermediate to bright
- Uterus:Myometrium (muscle wall) has intermediate signal, endometrium is generally high signal
- Ureter: Bright
- Synovial Fluid (hip joint): Bright
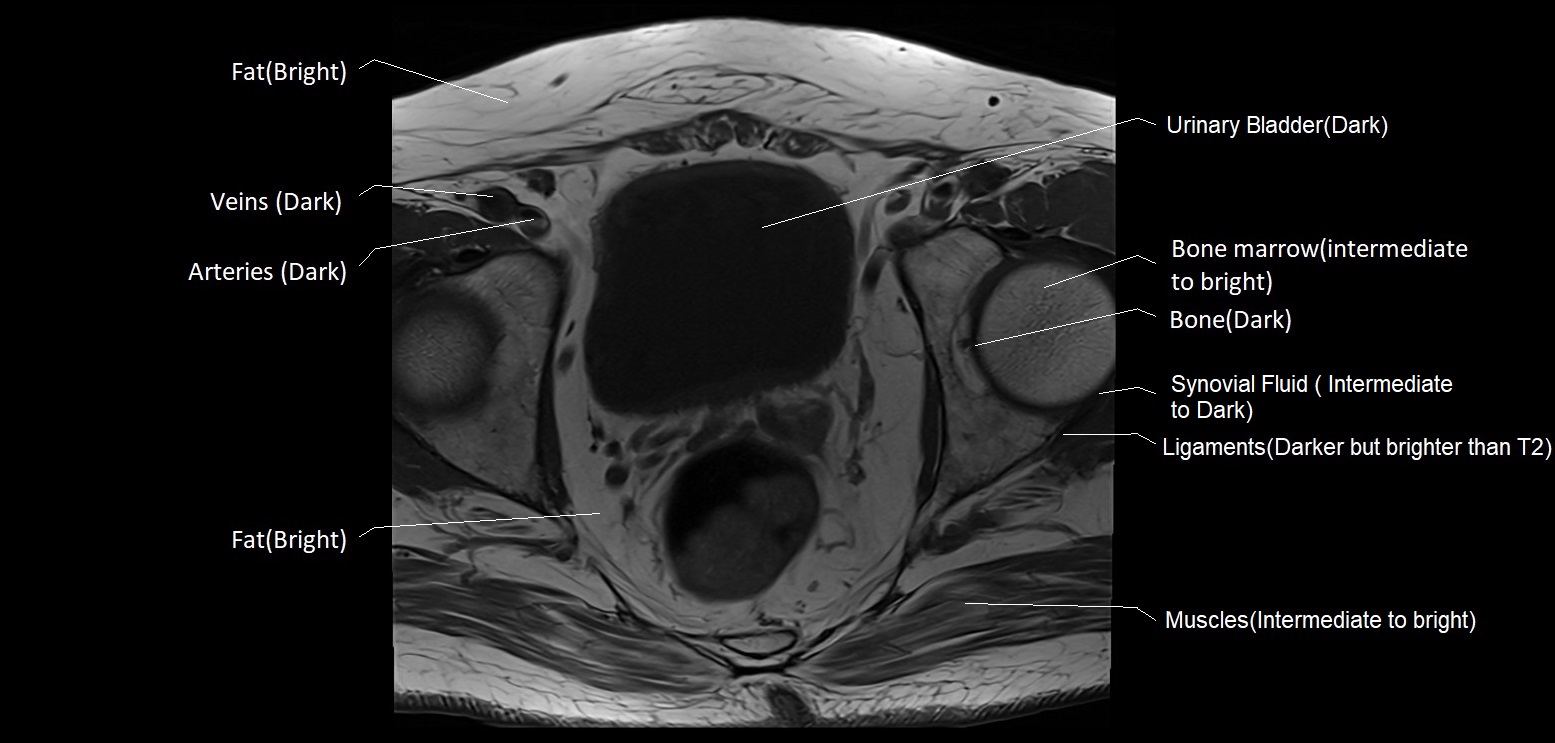
T1 appearance of the Pelvis
- Muscle: Intermediate.
- Bone: Dark
- Bone Marrow: Bright .
- Blood Vessels: Mostly Dark, Depending on flow characteristics, can be bright or dark.
- Fat: Bright
- Ligaments: Intermediate
- Nerve Roots: Intermediate signal
- Urinary Bladder: Dark (when filled with urine)
- Prostate:Intermediate Signal
- Uterus:Myometrium (muscle wall) is intermediate, endometrium varies with menstrual cycle
- Ureter: Dark
- Synovial Fluid (hip joint): Dark
T1 MRI Image of the Pelvis
T2 MRI Image of the Pelvis
T1 and T2 MRI Image Appearance of Various Structures in the Knee\ Other Joints
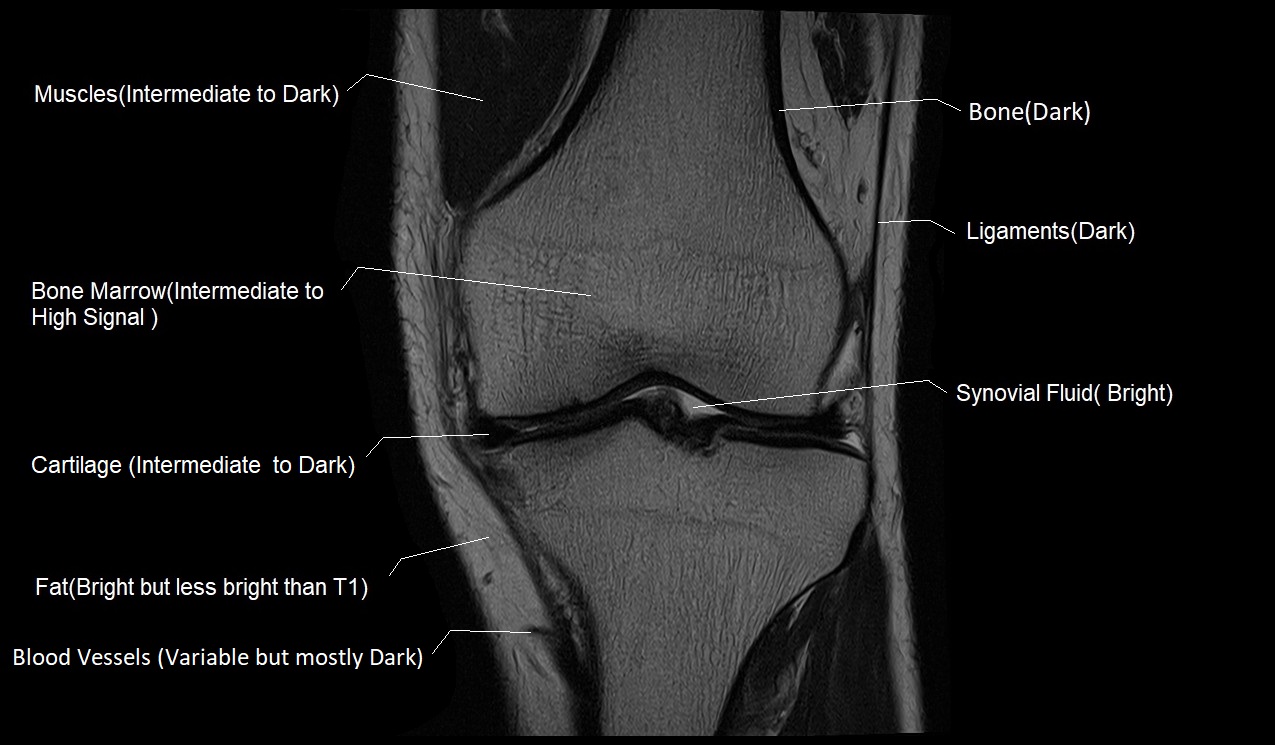
T2 appearance of the Knee
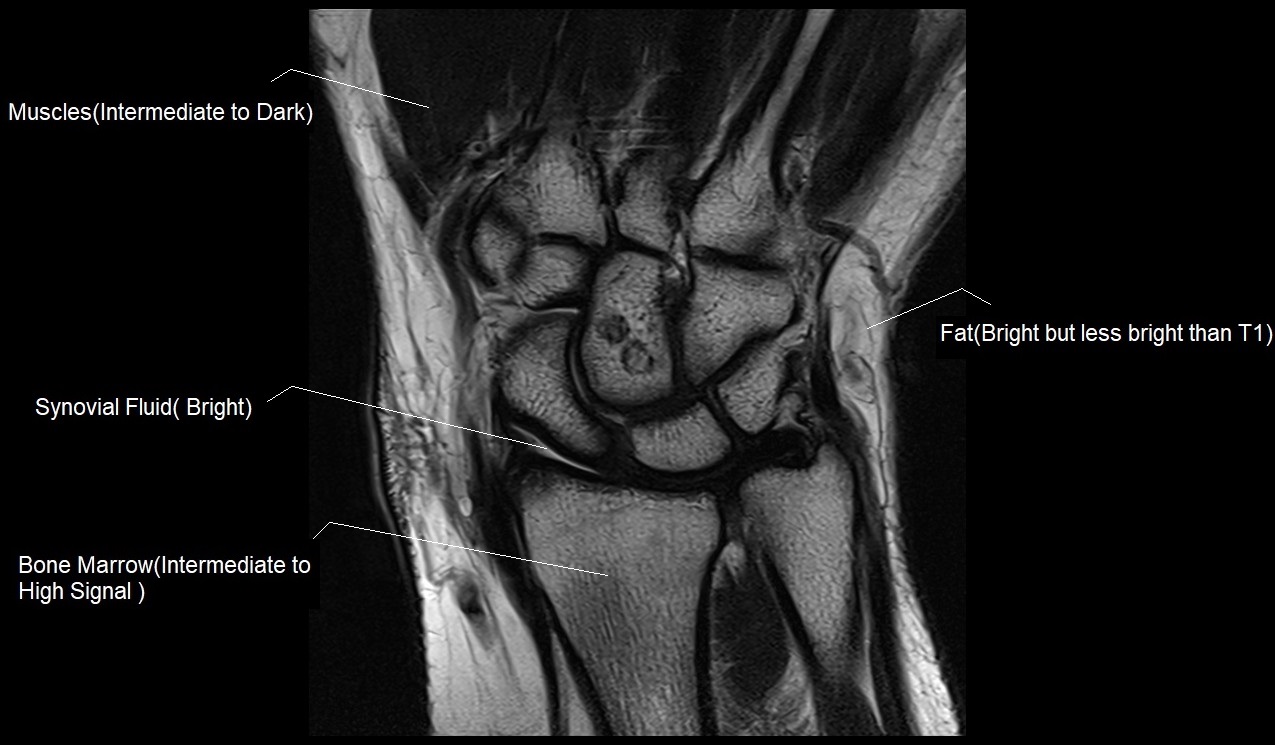
- Muscle: Intermediate to dark
- Bone: Dark (low signal)
- Bone Marrow: Intermediate to bright
- Blood Vessels: Mostly Dark, Depending on flow characteristics, can be bright or dark
- Fat: Bright but darker than T1
- Ligaments: Intermediate to dark.
- Nerve Roots: Intermediate signal
- Cartilage: Intermediate to dark
- Synovial Fluid: Bright
- Tendons : Intermediate to dark
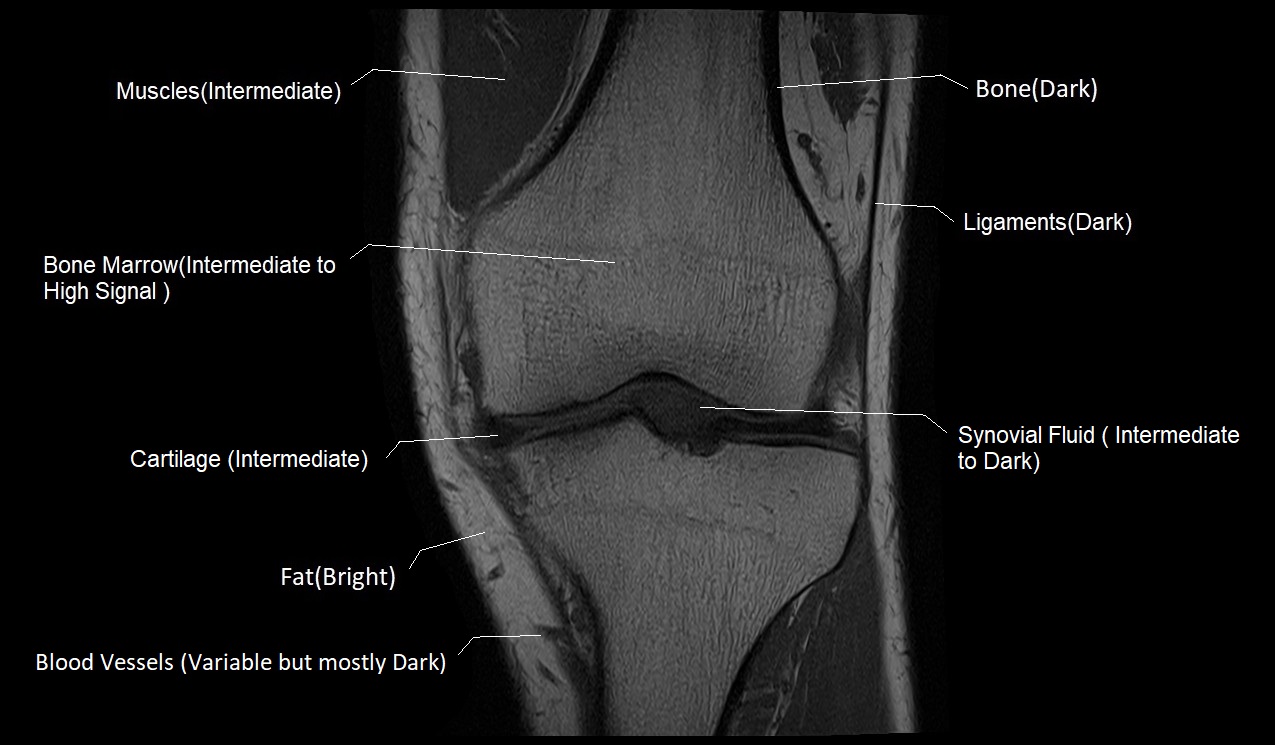
T1 appearance of the Knee
- Muscle: Intermediate.
- Bone: Dark
- Bone Marrow: Bright .
- Blood Vessels: Mostly Dark, Depending on flow characteristics, can be bright or dark.
- Fat: Bright
- Ligaments: Intermediate
- Nerve Roots: Intermediate signal
- Cartilage: Intermediate signal
- Synovial Fluid: Intermediate to dark
- Tendons : Intermediate to dark
T1 MRI Image of the Knee
T2 MRI Image of the Knee
T1 MRI Image of the Wrist

T2 MRI Image of the Wrist
T1 and T2 MRI pathology Appearance
In MRI, the signal intensity of tissues or pathological processes on T1-weighted (T1W) and T2-weighted (T2W) images is determined by the relaxation properties of hydrogen protons within them. On T1W images, areas with shorter T1 relaxation times appear bright, whereas on T2W images, areas with longer T2 relaxation times appear bright. Pathological processes, such as edema, inflammation, or tumors, often involve an increased water content. The presence of increased free water lengthens the T2 relaxation time, causing these areas to appear bright on T2W images. Conversely, the same regions often appear dark on T1W images because the free water has a longer T1 relaxation time. This contrast difference is pivotal in MRI’s ability to discern pathology, as these signal changes against the backdrop of normal anatomy highlight areas of concern. Here are some examples of how various pathologies appear in T1 and T2 imaging.
T1 appearance
- Edema/Inflammation: Low Signal
- Acute Hemorrhage: Variable (depending on various phases of hemorrhage)
- Cysts: Low Signal
- Tumors: Variable but mostly low signal(depending on the tumor type, vascularity, and presence of necrosis)
- Abscess: Low Signal
- Fatty Lesions (e.g., Lipoma):High Signal
- Fibrosis: Low to Intermediate Signal
- Degenerated Disc Disease (in the spine): Low Signal
- Avascular Necrosis (bone): Low Signal in the necrotic area
- Multiple Sclerosis (MS) Plaques (in the brain):Low Signal
- Infarction (e.g., stroke in the brain): Low Signal
- Demyelination: Variable, often Low Signal
T2 appearance
- Edema/Inflammation: High Signal
- Acute Hemorrhage: Variable (depending on various phases of hemorrhage)
- Cysts: High Signal
- Tumors: Variable but mostly High signal(depending on the tumor type, vascularity, and presence of necrosis)
- Abscess: High Signal for the liquid center with a low signal capsule
- Fatty Lesions (e.g., Lipoma):High Signal
- Fibrosis: Low Signal
- Degenerated Disc Disease (in the spine):Variable; may see High Signal with annular tears
- Avascular Necrosis (bone): Variable; often High Signal in the early stages
- Multiple Sclerosis (MS) Plaques (in the brain):High Signal
- Infarction (e.g., stroke in the brain):High Signal in acute phase
- Demyelination:High Signal
T1 MRI Image of the Renal cyst

T2 MRI Image of the Renal cyst

T2 MRI Image of myositis

References
- Knight, M. J., McCann, B., Tsivos, D., Couthard, E. C., & Kauppinen, R. A. (2016). Quantitative T1 and T2 MRI signal characteristics in the human brain: different patterns of MR contrasts in normal ageing. MAGMA (New York, N.y.), 29(6), 833–842.
- Schwer, A., McCammon, R., Kavanagh, B., Gaspar, L., Damek, D., & Chen, C. (2007). Magnetic Resonance Imaging (MRI) T1 and T2 Volumetric Changes and their Implications after Hypofractionated Stereotactic Radiotherapy (SRS) in Patients with Recurrent Malignant Gliomas. Poster Discussion Presentation, International Journal of Radiation Oncology, Biology, Physics, 69(3), Supplement, S167.
- van Gastel, M.D.A., Messchendorp, A.L., Kappert, P., Kaatee, M.A., de Jong, M., Renken, R.J., ter Horst, G.J., Mahesh, S.V.K., & Gansevoort, R.T. (2018). T1 vs. T2 weighted magnetic resonance imaging to assess total kidney volume in patients with autosomal dominant polycystic kidney disease. Abdominal Radiology, 43(10), 1215–1222. doi:10.1007/s00261-017-1269-0
- Haacke, E. M., Brown, R. W., Thompson, M. R., & Venkatesan, R. (1999). Magnetic resonance imaging: Physical principles and sequence design. John Wiley & Sons.
- Hennig, J., Nauerth, A., & Friedburg, H. (1986). RARE imaging: a fast imaging method for clinical MR. Magnetic resonance in medicine, 3(6), 823-833.
- Edelman, R. R., Hesselink, J. R., Zlatkin, M. B., & Crues, J. V. (2006). Clinical magnetic resonance imaging (Vol. 1). WB Saunders.
- van Gastel, M.D.A., Messchendorp, A.L., Kappert, P., Kaatee, M.A., de Jong, M., Renken, R.J., Ter Horst, G.J., Mahesh, S.V.K., Gansevoort, R.T.; DIPAK Consortium. (2018). T1 vs. T2 weighted magnetic resonance imaging to assess total kidney volume in patients with autosomal dominant polycystic kidney disease. Abdom Radiol (NY), 43(5), 1215-1222. doi: 10.1007/s00261-017-1285-2. PMID: 28871393 PMCID: PMC5904223.


