Oligodendroglioma MRI
Sturge-Weber Syndrome (SWS), also known as encephalotrigeminal angiomatosis, is a rare congenital neurological and skin disorder. It is characterized by abnormal blood vessels on the brain surface and skin, leading to a variety of symptoms.
Classification
SWS is classified based on the areas of the body affected:
Type I (Classic Sturge-Weber Syndrome): This type involves facial and leptomeningeal angiomas (abnormal blood vessel formations in the brain’s surface) and may include glaucoma.
Type II: This type involves a facial angioma without evidence of leptomeningeal involvement or neurological symptoms, but may include glaucoma.
Type III: This type involves only leptomeningeal angiomas with no facial involvement, but neurological symptoms are present.
Cause
Sturge-Weber syndrome is caused by a somatic mutation in the GNAQ gene. This mutation occurs after conception and is not inherited from the parents; instead, it arises spontaneously in one of the developing cells. The mutation affects the development of certain blood vessels, leading to the abnormalities seen in the syndrome.
Symptoms
Symptoms of Sturge-Weber syndrome can vary significantly but typically include:
- Port-wine stain: A reddish-purple birthmark typically appearing on one side of the face, often over the forehead and eyelid.
- Neurological symptoms: These can include seizures, which may begin in infancy and vary in severity. Additional issues may involve weakness on one side of the body, developmental delays, and migraines.
- Eye problems: Glaucoma is common, occurring in about 30% of those with a facial port-wine stain. It can lead to increased pressure in the eye that can cause damage to the optic nerve.
Diagnosis
Diagnosis of Sturge-Weber syndrome typically involves:
- Medical history and physical examination: Including detailed assessment of the skin and neurological symptoms.
- Imaging studies: MRI (magnetic resonance imaging) of the brain to detect leptomeningeal angiomas and look for evidence of brain involvement.
- Eye examination: To check for signs of glaucoma and other ocular issues.
Treatment
Treatment of Sturge-Weber syndrome is symptomatic and tailored to the individual needs of the patient:
- Management of seizures: Anticonvulsant medications are prescribed to control seizures.
- Treatment for glaucoma: Medications, laser treatments, or surgery may be required to manage glaucoma.
- Laser treatment for port-wine stain: Pulsed dye laser can be used to lighten the skin marking, although multiple treatments are often necessary.
- Physical therapy and educational support: These are recommended to address developmental delays and neurological issues.
- Regular monitoring: Continuous assessment by a team of specialists, including neurologists, dermatologists, and ophthalmologists, is crucial.
MRI appearance of Oligodendroglioma
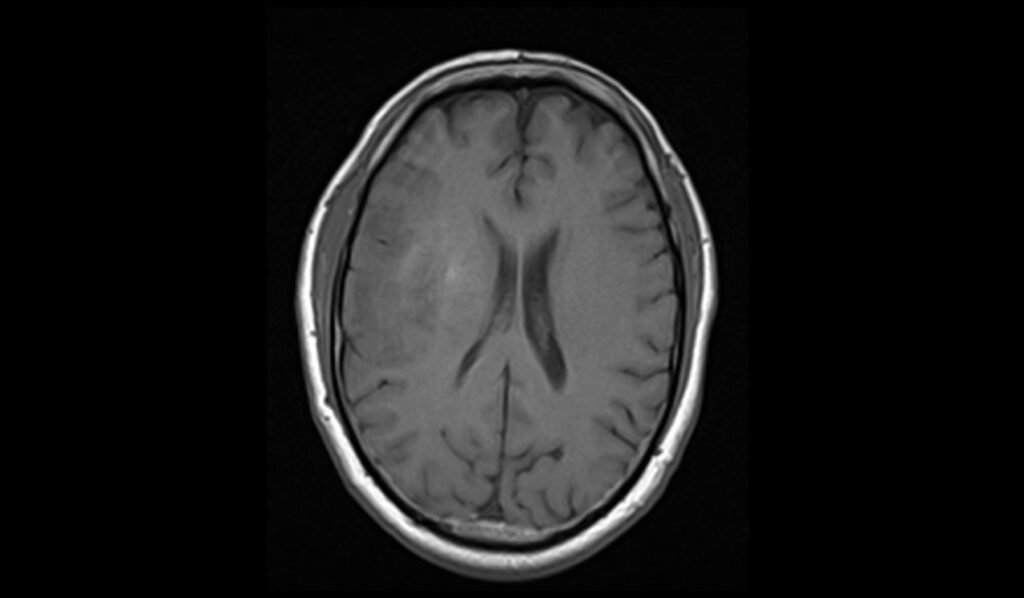
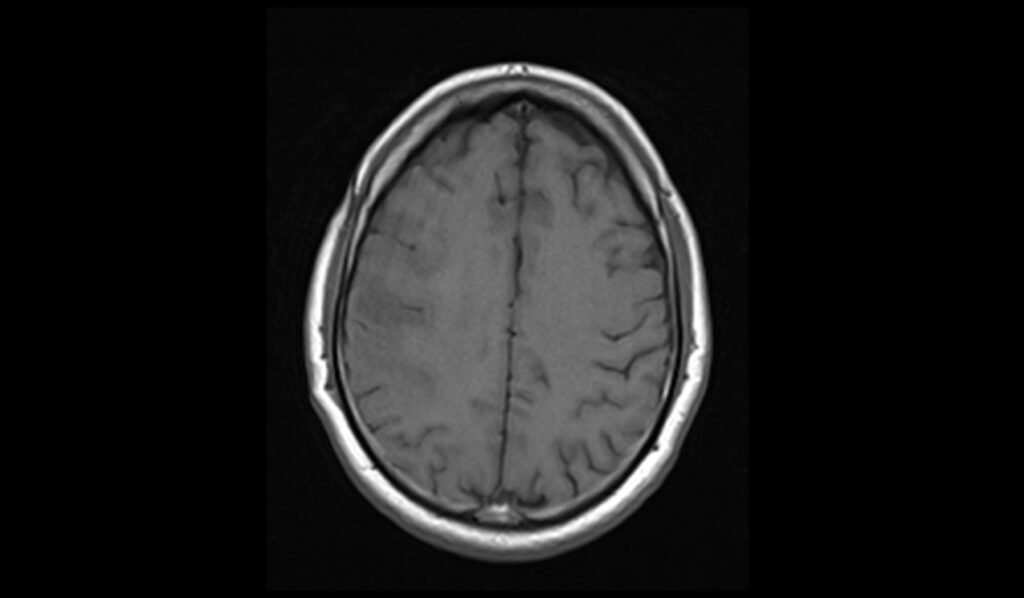
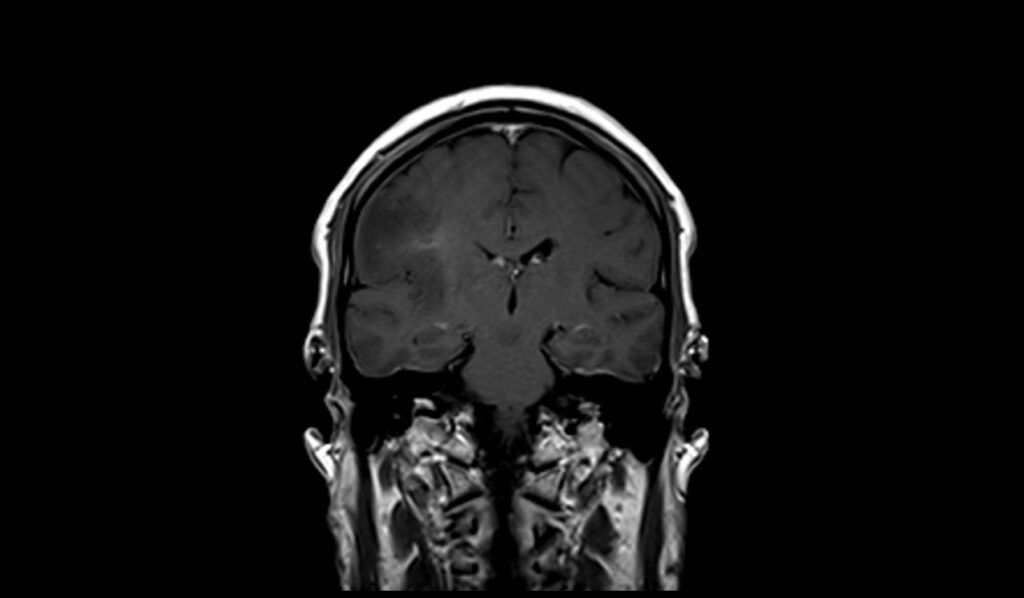
MRI T1 Appearance of Oligodendroglioma
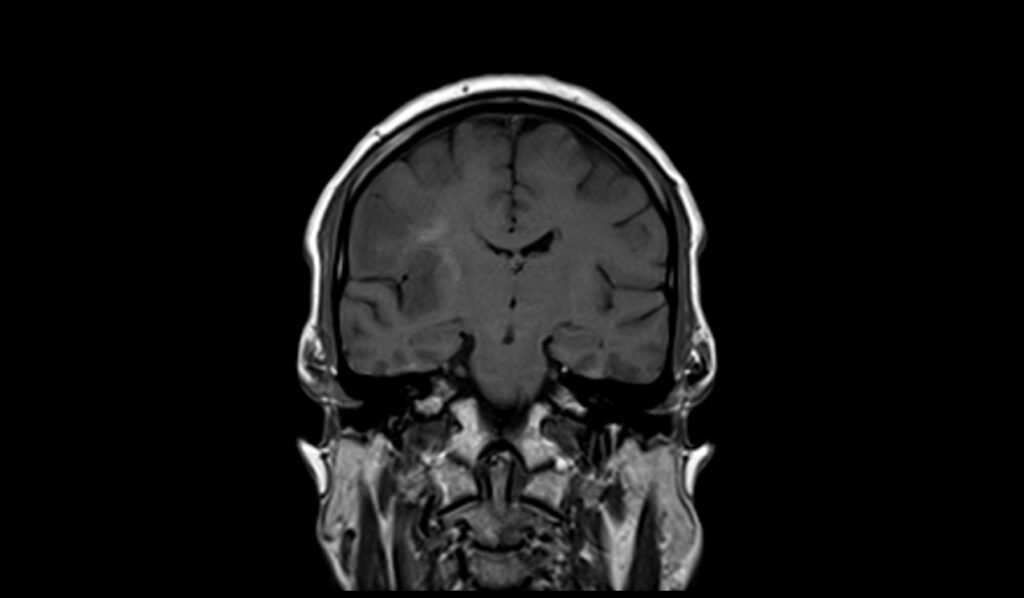
On T1-weighted MRI images, oligodendrogliomas typically appear as hypointense (darker) regions compared to the surrounding normal brain tissue. These tumors often exhibit relatively well-defined borders, but their appearance can vary depending on the degree of cellularity and the presence of calcifications. Calcifications within the tumor may appear as hyperintense (brighter) spots on T1-weighted images. In some cases, oligodendrogliomas may also cause mass effect, leading to a displacement of adjacent brain structures.
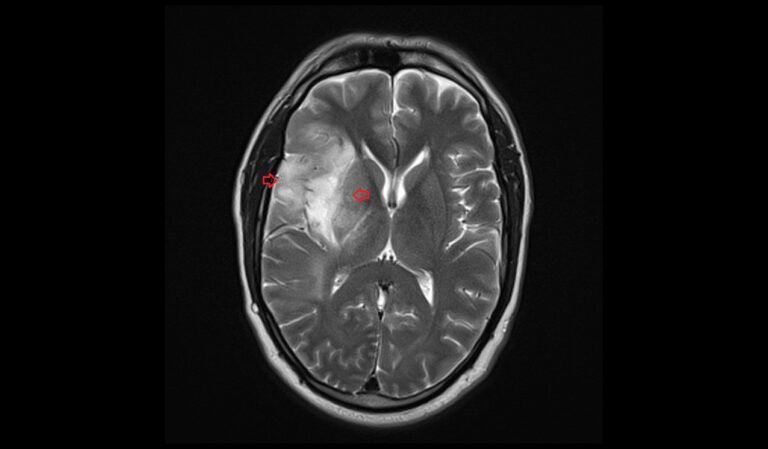
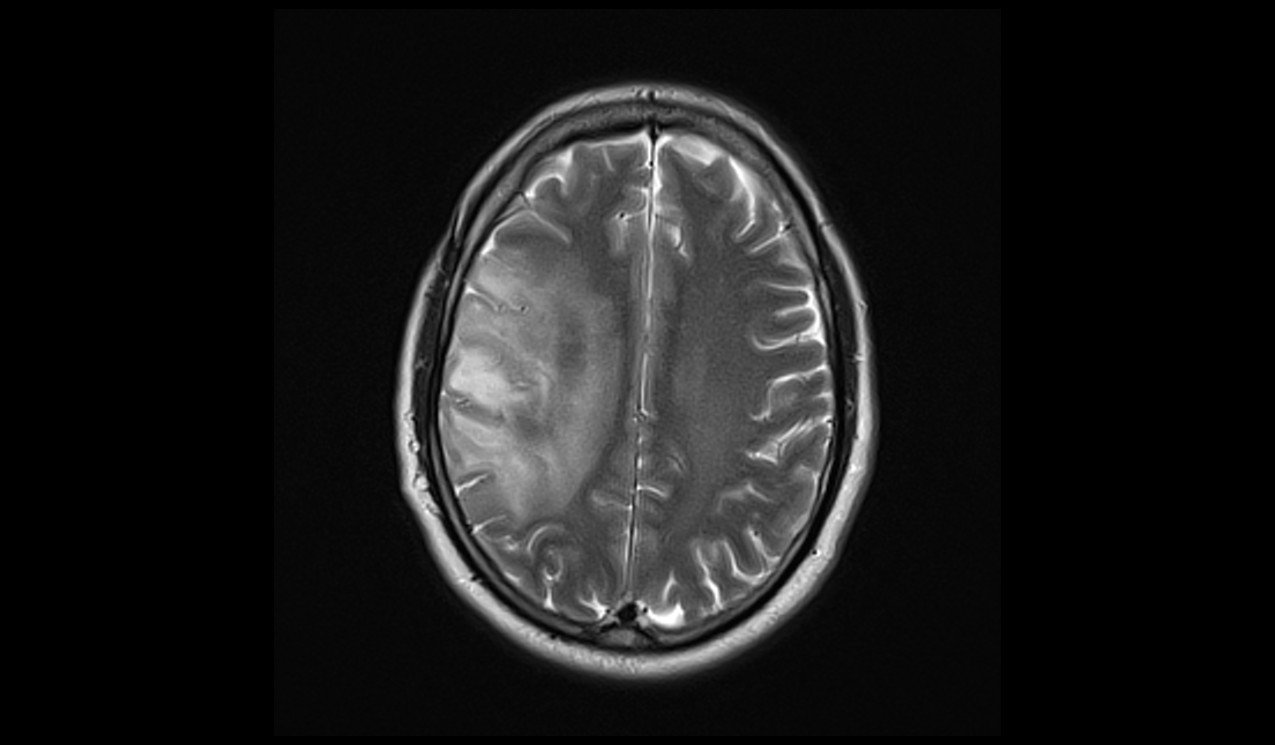
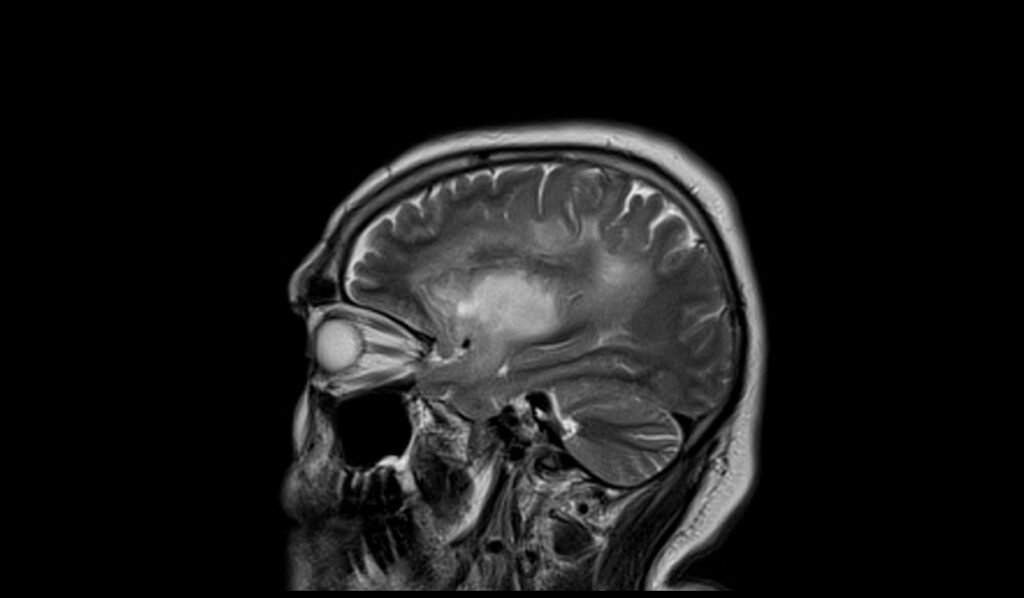
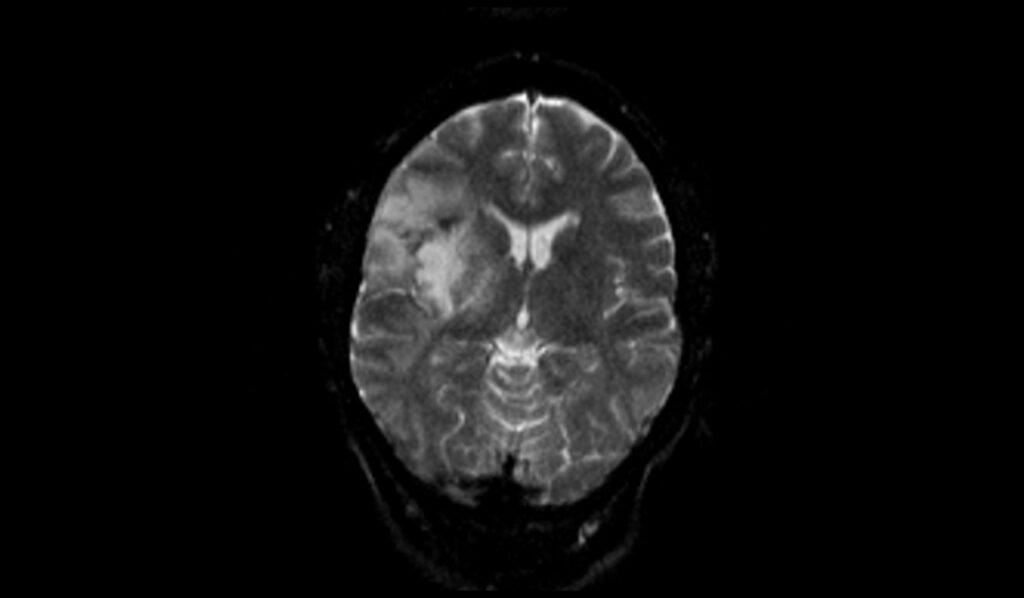
MRI T2 Appearance of Oligodendroglioma
On T2-weighted MRI images, oligodendrogliomas usually present as hyperintense (brighter) regions, indicating areas of increased water content within the tumor. The high signal intensity on T2 images helps in delineating the tumor margins more clearly than on T1-weighted images. These tumors often appear relatively homogeneous, but may also show areas of cystic change or necrosis, contributing to a heterogeneous appearance. The surrounding brain tissue may show signs of edema, which also appears hyperintense on T2-weighted images.
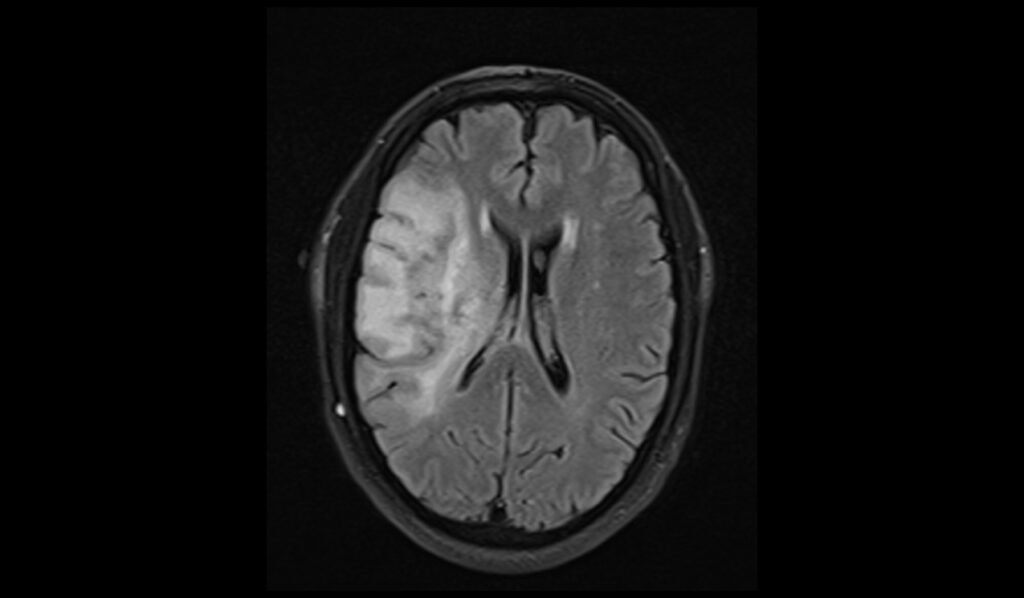
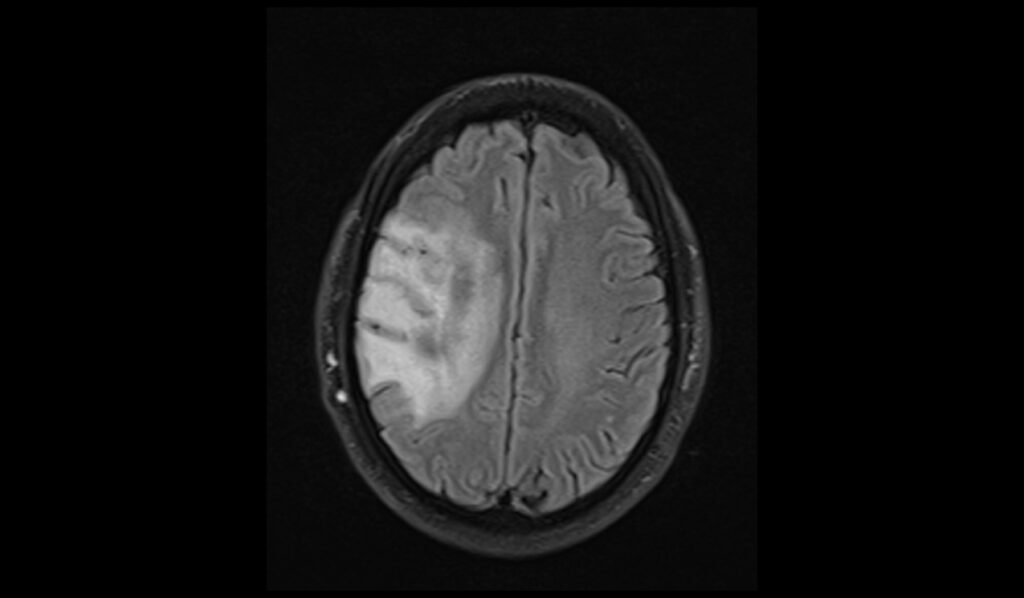
MRI FLAIR Appearance of Oligodendroglioma
Fluid-Attenuated Inversion Recovery (FLAIR) MRI sequences are useful for highlighting lesions by suppressing the cerebrospinal fluid (CSF) signal, thereby enhancing the contrast between the tumor and normal brain tissue. Oligodendrogliomas typically appear hyperintense on FLAIR images, similar to their appearance on T2-weighted images. FLAIR images are particularly effective in detecting peritumoral edema and in differentiating tumor tissue from CSF-filled spaces, providing a clearer picture of the tumor extent and its impact on surrounding structures.
MRI DWI b0 Appearance of Oligodendroglioma
In the b0 diffusion-weighted imaging (DWI), oligodendrogliomas typically appear as areas with signal characteristics similar to T2-weighted images, showing hyperintensity due to their high water content. This sequence serves as a baseline for comparing higher b-value images, providing essential context for assessing diffusion characteristics and any potential changes indicative of pathological processes.
MRI DWI b1000 Appearance of Oligodendroglioma
On DWI with a b-value of 1000, oligodendrogliomas generally do not show restricted diffusion, which would appear as areas of high signal intensity. Instead, these tumors often exhibit intermediate to low signal intensity, reflecting their cellular architecture and water diffusivity.
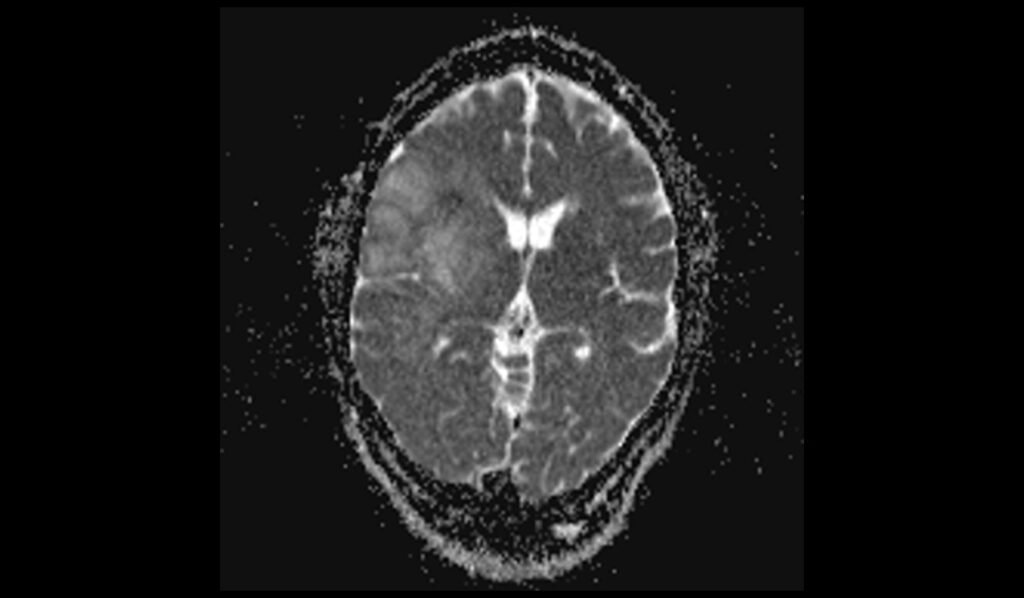
MRI ADC Appearance of Oligodendroglioma
Apparent Diffusion Coefficient (ADC) maps of oligodendrogliomas typically demonstrate high ADC values, indicating facilitated diffusion due to the tumor’s relatively low cellular density compared to other high-grade gliomas. This lack of restricted diffusion helps differentiate oligodendrogliomas from more aggressive tumors.
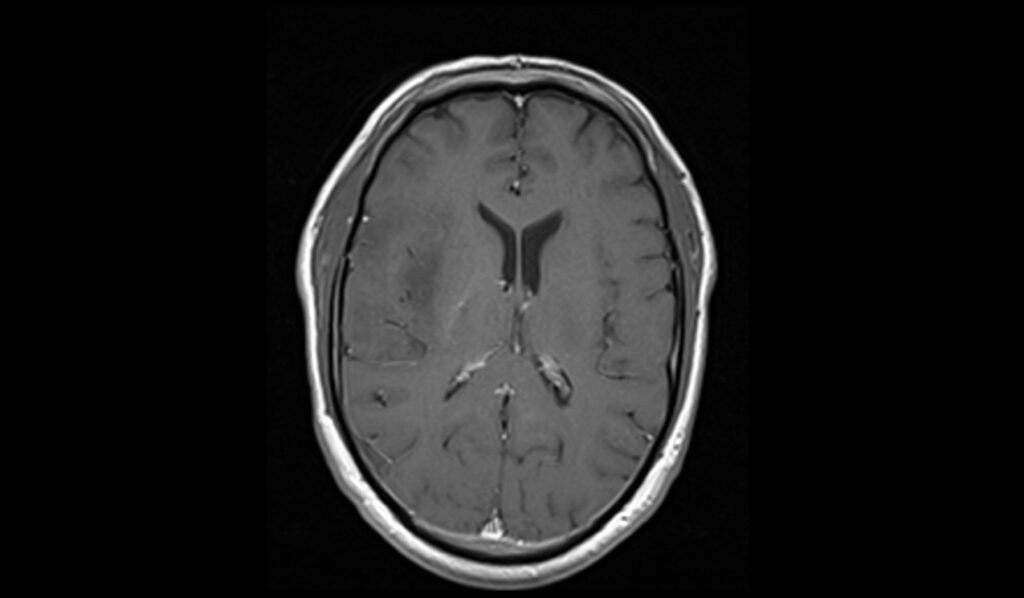
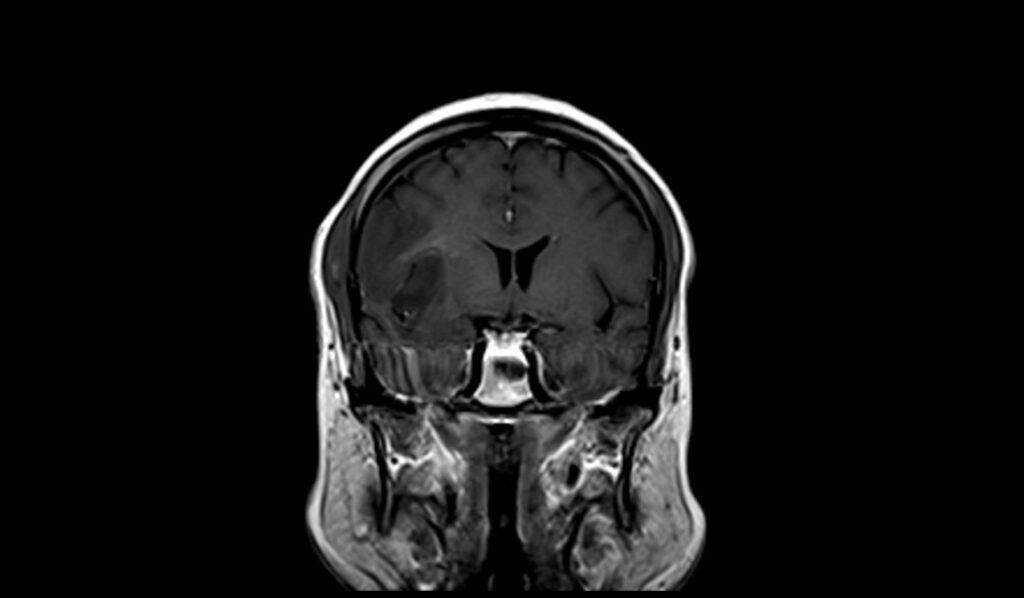
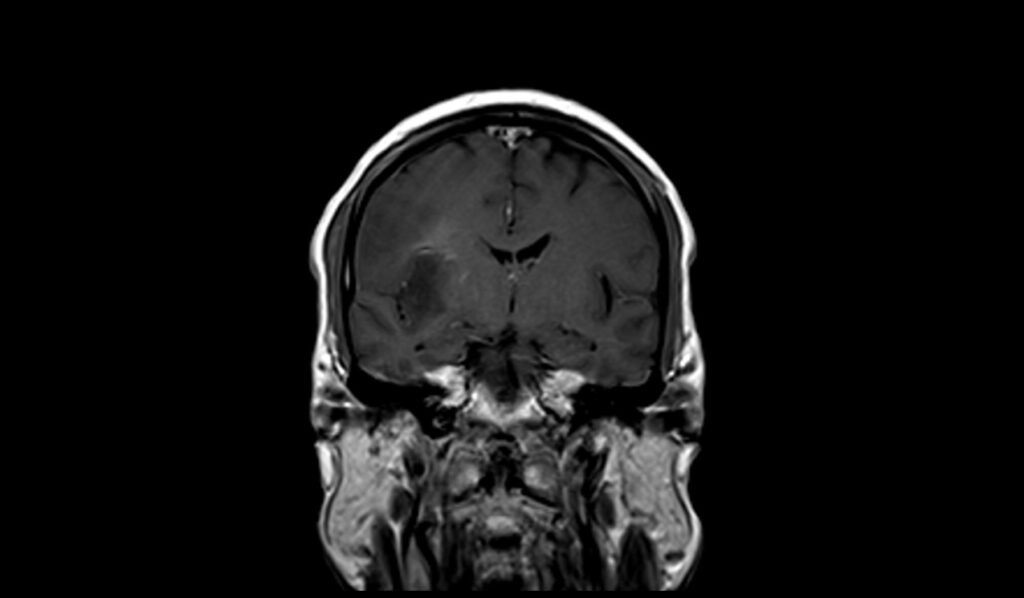
MRI T1 Post-Contrast Appearance of Oligodendroglioma
On post-contrast T1-weighted images, oligodendrogliomas may exhibit variable enhancement patterns. Some tumors show minimal or no enhancement, while others may demonstrate moderate to marked enhancement, indicating disruption of the blood-brain barrier. The presence of enhancement helps in identifying active tumor regions and can aid in surgical planning and assessing response to therapy. Contrast enhancement also highlights areas of necrosis or cystic components, which may not be as apparent on pre-contrast images.
T2 axial image shows Oligodendroglioma

FLAIR axial image shows Oligodendroglioma

T1 axial images shows Oligodendroglioma

T2 sagittal images shows Oligodendroglioma
T1 coronal images shows Oligodendroglioma
DWI b0 images shows Oligodendroglioma
DWI b1000 images shows Oligodendroglioma

DWI ADC images shows Oligodendroglioma
T1 post contrast axial images shows Oligodendroglioma

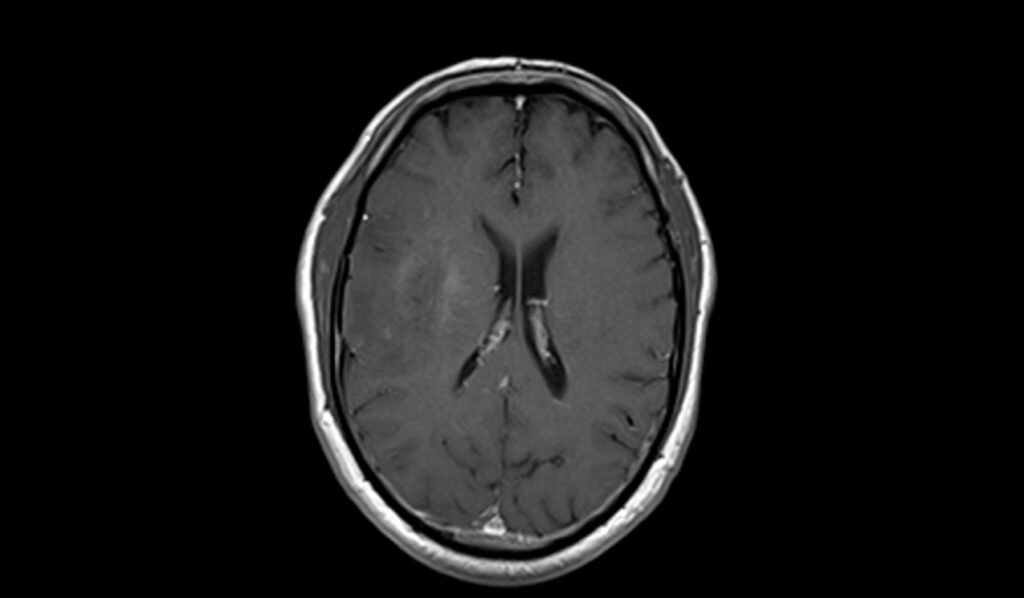
T1 post contrast coronal images shows Oligodendroglioma
References
- Tork, C. A., & Atkinson, C. (2023, August 28). Oligodendroglioma. In StatPearls [Internet]. Retrieved from https://www.ncbi.nlm.nih.gov/books/NBK562320/
- mits, M. (2016). Imaging of oligodendroglioma. British Journal of Radiology, 89(1060), 20150857. https://doi.org/10.1259/bjr.20150857
- Koeller, K. K., & Rushing, E. J. (2005). Oligodendroglioma and its variants: Radiologic-pathologic correlation. RadioGraphics, 25(6). https://doi.org/10.1148/rg.256055137
- Choi, C. G., Chang, K. H., Han, M. H., Chi, J. G., & Han, M. C. (Year). Cerebral oligodendroglioma: MRI versus histopathological grading. In Proceedings of the XV Symposium Neuroradiologicum (pp. 163-165).